
Pi Network is approaching a key development milestone, with 9,120 AI-powered applications created through its no-code App Studio. Of these, 30 apps have already launched on the mainnet, placing the project close to a 10,000-app total.

Introduced during the recent Pi2Day event, App Studio enables users—referred to as Pioneers—to build functional AI apps by simply describing their ideas in plain language. The tool requires no coding knowledge, expanding access to app creation within the Pi ecosystem.
Several applications are already live on the mainnet, including Map of Pi, Fruity Pi, CARE FOR PI, Link for Pi, Thepitogo Services, World OF PI Mainnet, LatinChain Platform, 1pi Mall, WorkforcePool, and PlayGames.
However, developer engagement with the platform has sparked concerns. A user known as Dr Altcoin posted on X that the App Studio hit a limit at 8,430 accepted apps, preventing new users from deploying their builds. The restriction surprised many in the community. One user responded,
“8430 app limit? I can’t even laugh, my head might hurt!”
Others criticized the rollout, calling it disorganized and questioning the utility of most of the submitted applications.

Despite the criticism, interest in the platform remains high. New apps continue to go live, and the total app count is climbing steadily. Although the Pi Core Team has not confirmed a firm cap, developers suggest the 10,000-app mark will be reached soon unless new restrictions are introduced.
Pi Network (PI/USDT) Forms Bullish Falling Wedge on Daily Chart — July 7, 2025
The chart, created on July 7, 2025, shows that Pi Network (PI/USDT) is trading at $0.4558 on the OKX exchange. On the daily timeframe, the chart forms a bullish falling wedge pattern. This pattern appears when the price makes lower highs and lower lows between two converging trendlines. It signals that the downtrend is losing strength and may soon reverse to the upside.
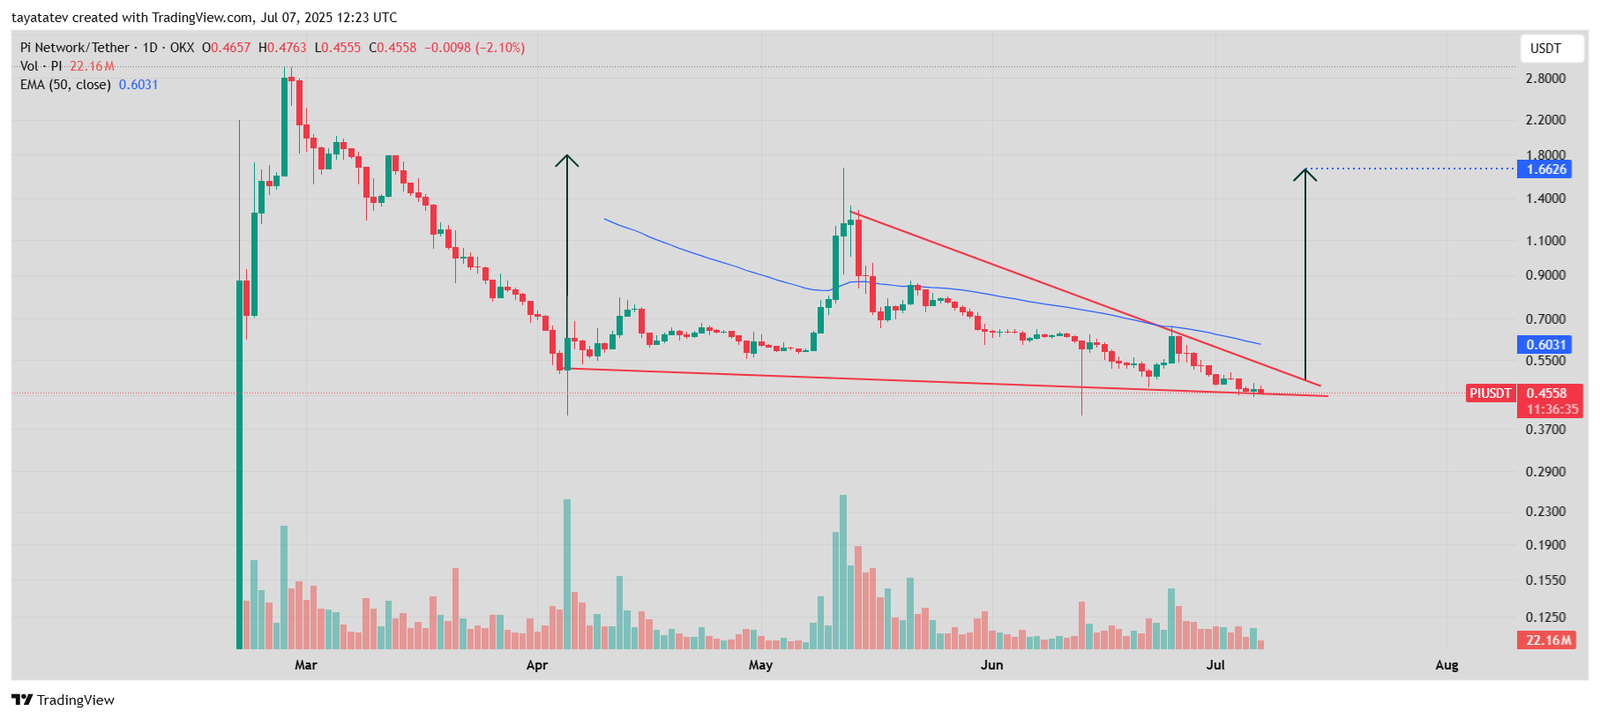
The wedge began to take shape in early June. The resistance line slopes downward while the support line remains relatively flat. As the space between the lines narrows, the price approaches the point where a breakout could happen. This setup often leads to a strong upward move once buyers step in.
If the breakout happens, the expected price move is based on the height of the wedge. That projection suggests a possible 263 percent increase from the current level. This means the price could rise from $0.4558 to about $1.6626. A 50-day Exponential Moving Average (EMA), currently at $0.6031, sits above the price and may act as a resistance level during the move.
Right now, the breakout is not confirmed. Traders usually wait for the price to close above the wedge’s upper line with strong volume before calling it a breakout. If that happens, it could mark the beginning of a sharp upward trend.
Pi Network RSI Nears Oversold Zone, Signaling Weak Momentum
On July 7, 2025, the daily Relative Strength Index (RSI) for Pi Network (PI/USDT) dropped to 33.48, approaching the commonly watched 30-point threshold that signals oversold conditions. The 14-day RSI remains below its moving average, which stands at 39.21, indicating that bearish momentum is still in control.
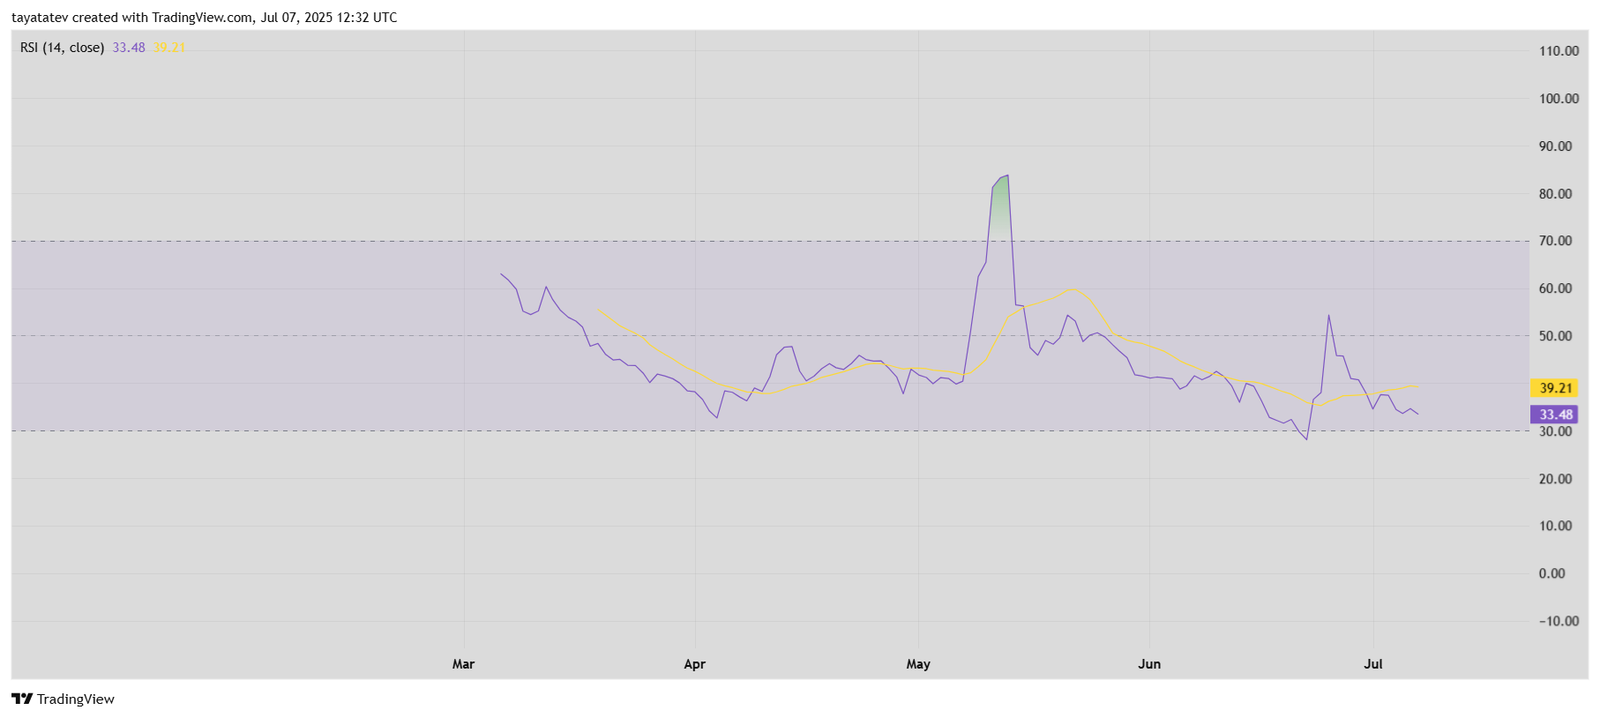
The current RSI level places Pi Network just above the oversold boundary. This position often suggests weakening selling pressure, though no clear reversal has appeared yet. Momentum remains low, and traders have not yet shown a strong return to accumulation.
In previous months, Pi Network’s RSI reached similar levels in early April and mid-May. Both times, the indicator reversed upward shortly before price spikes. However, in the current setup, RSI continues to lag below the neutral 50 mark and its own average, showing hesitation from buyers.
Unless the RSI breaks back above 40 and gains strength, Pi’s short-term trend may stay weak. For now, technical momentum remains in negative territory, with no immediate signal of a bullish shift.
Pi Network’s Balance of Power Shows Bearish Control
Meanwhile, the Balance of Power (BOP) indicator for Pi Network (PI/USDT) stood at –0.40, suggesting that sellers currently hold control over the market. The BOP measures the strength of buyers versus sellers by comparing the close price to the trading range over a set period. Negative values, especially those nearing –0.50 or lower, indicate that selling pressure is dominating.
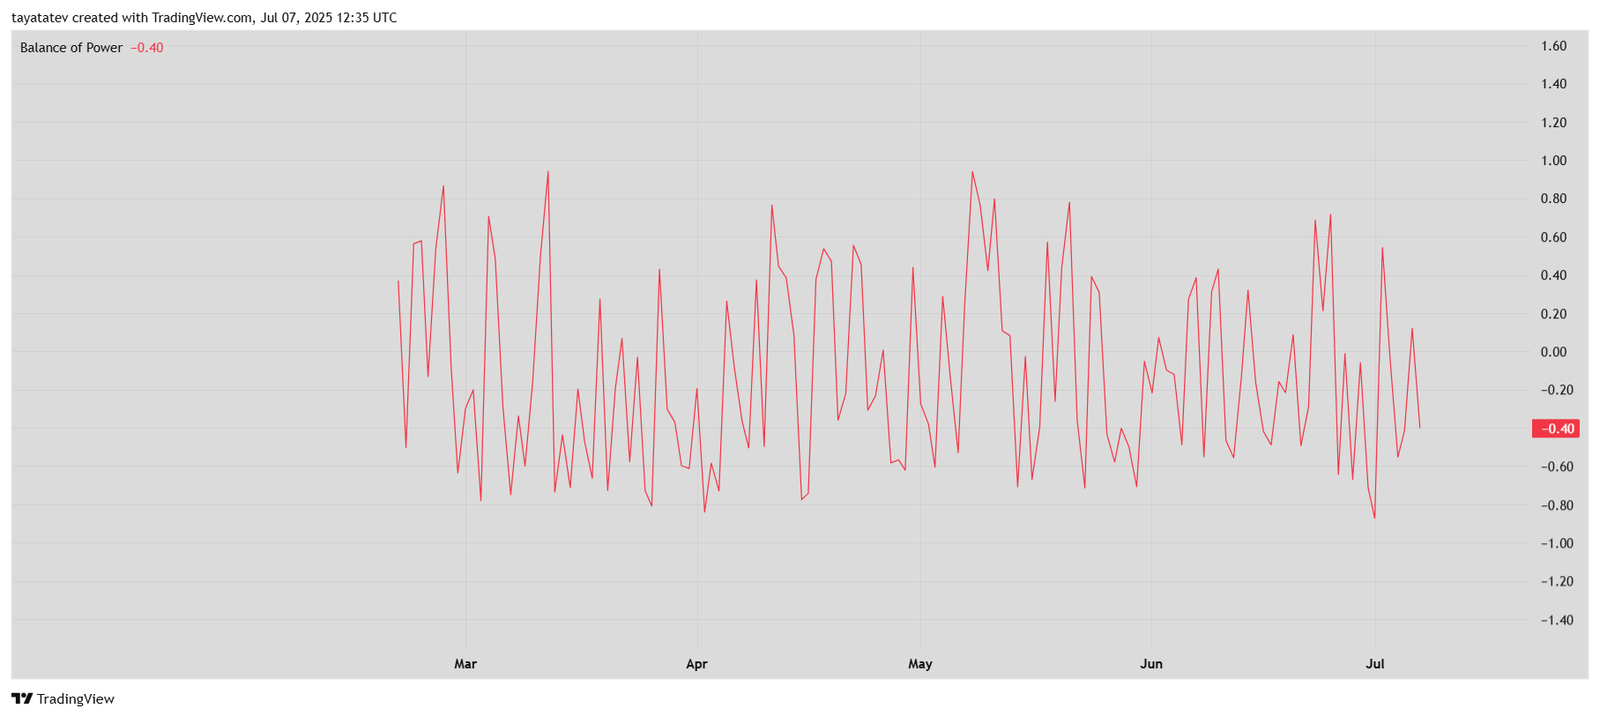
The BOP has fluctuated sharply in recent months but remained mostly below the neutral zero line, signaling an ongoing struggle for buyers to gain momentum. Although the indicator showed occasional spikes into positive territory in May and June, they did not hold, and selling activity quickly resumed.
With the current BOP at –0.40, market sentiment remains tilted toward the bearish side. Until this trend shifts closer to zero or moves positive, traders may view the current market structure as weak. The indicator reinforces the broader technical picture where bulls have not yet reclaimed control.
Stochastic Momentum Index for Pi Network Signals Deep Oversold Territory
The Stochastic Momentum Index (SMI) for Pi Network (PI/USDT) dropped to –79.30, with its signal line trailing slightly higher at –77.54. These values place both the SMI and its signal line well below the –40 threshold, indicating that Pi is trading in deep oversold conditions.
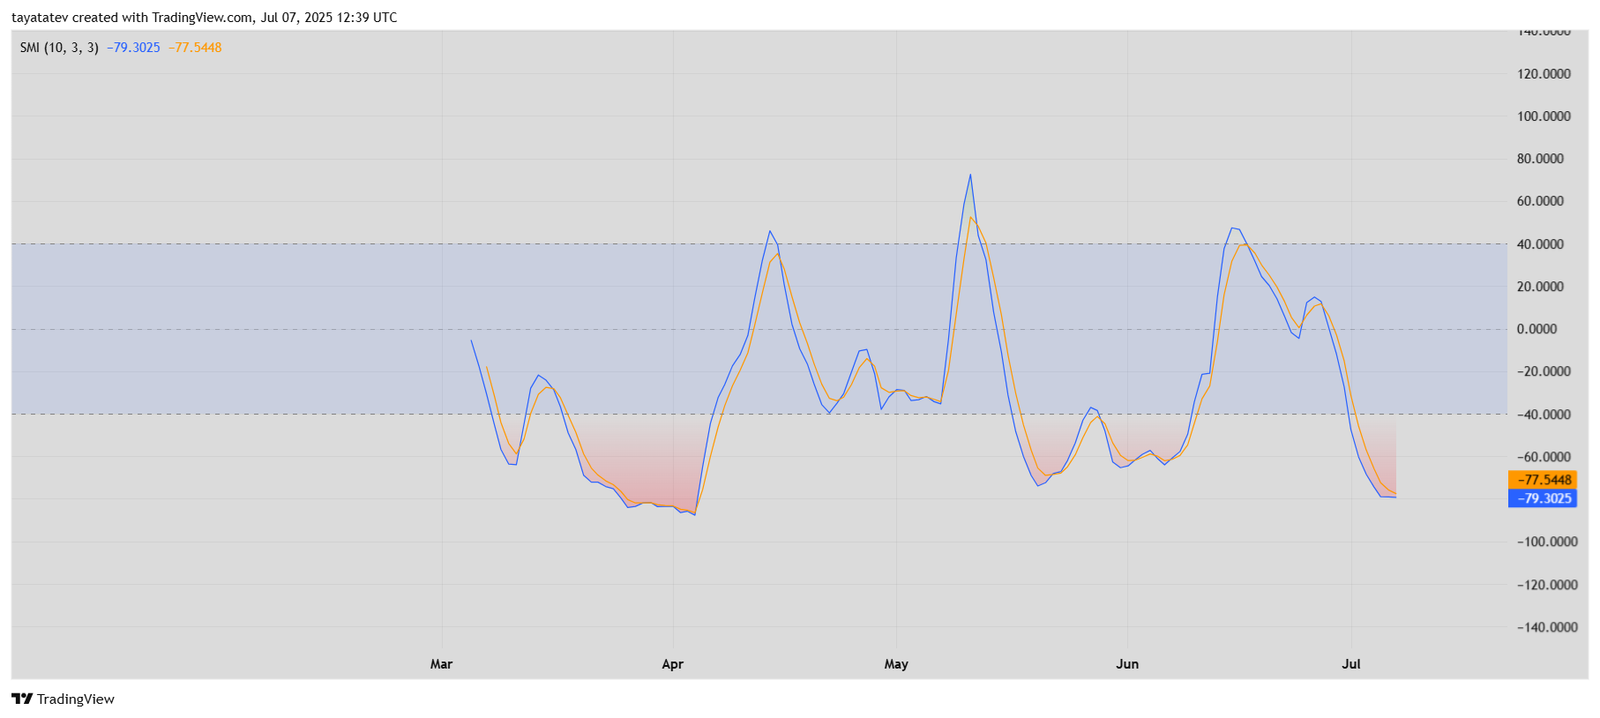
The SMI, a refined version of the traditional Stochastic Oscillator, helps measure the closing price’s position relative to its high-low range over a set period. When both the SMI and its signal line fall below –40, it often signals that sellers have dominated recent sessions, and a potential reversal may form if momentum shifts.
Over the past few months, similar dips below –60 on the SMI have preceded short-term upward price moves. However, at present, there is no sign of a crossover or bullish divergence, meaning selling pressure continues to outweigh buying interest.
Until the SMI curve flattens or crosses above its signal line, the indicator points to sustained bearish momentum. Pi Network remains technically oversold, but without confirmation, reversal signals remain weak.
