
On May 29, 2025, new developments reignited speculation around a possible Pi Network listing on Binance. The rumors followed recent ecosystem upgrades and upcoming events that align with Binance’s listing criteria.
Pi Network has made several strides toward decentralization. The project has started shutting down central nodes and plans to release its source code. This move would mark a shift to an open-source model, reinforcing its claim of community-driven development.
At the same time, the Pi ecosystem has expanded rapidly. More than 102 million users are actively mining or building applications. The network now supports hundreds of decentralized apps, wallets, and utility tools.
Key services likeKYC, wallet migration, and Pi-based payment systems have improved in speed and accessibility. These updates have increased user trust and helped streamline ecosystem participation.
Currently, Pi Network is listed on exchanges like OKX, Bitget, MEXC, and Kraken Pro, which even introduced futures trading for the token. However, Binance has yet to confirm support.
Pi Network Price Faces 40% Drop as Bearish Pennant Breakdown Begins
On May 30, 2025, the 4-hour chart of Pi Network to Tether (PI/USDT) on OKX revealed a bearish pennant pattern.
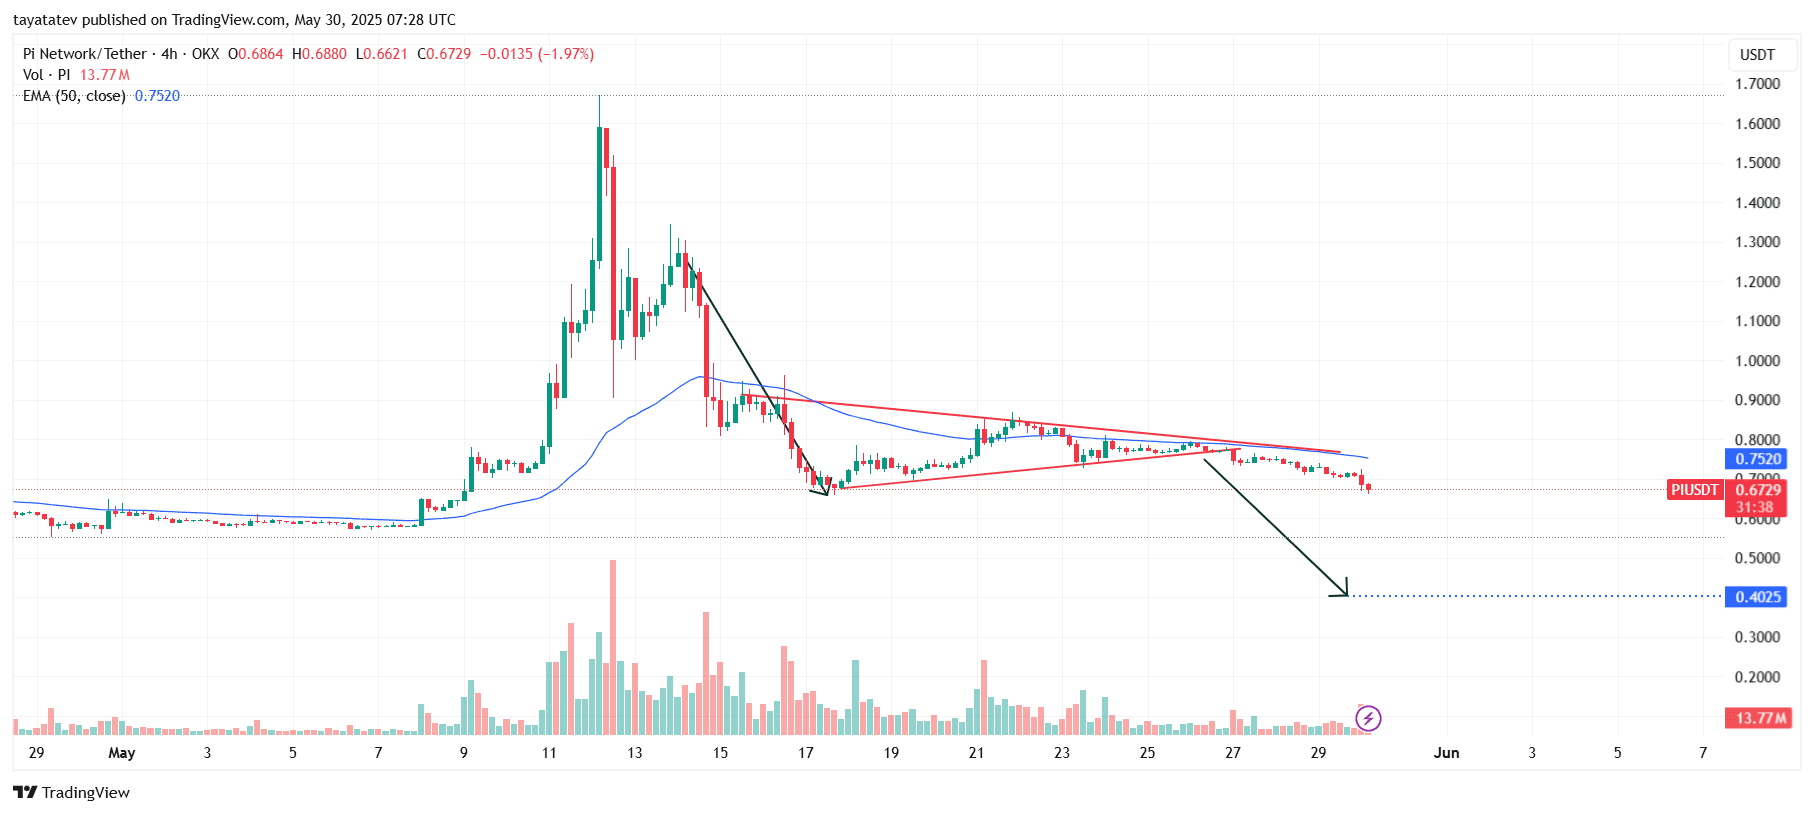
A bearish pennant forms when the price sharply drops, then consolidates inside converging trendlines, often leading to further decline once support breaks.
In this case, the pennant began forming after a steep drop from the $1.70 zone on May 13, which shaped the pattern’s pole. Between May 17 and May 27, the price moved sideways inside narrowing trendlines, with weaker volume confirming a typical consolidation phase.
Now, the PI/USDT pair has broken below the lower boundary of the pennant near the $0.70 zone. This breakdown has triggered fresh selling pressure. As of the current price at $0.6729, Pi Network is down approximately 14% from the point where the pennant formed.
If the pattern confirms fully, the price could fall by another 40%, targeting around $0.4025. The projected drop reflects the height of the initial pole, measured from the point of breakdown.
The 50-period Exponential Moving Average (EMA), currently at $0.7520, acts as dynamic resistance and sits well above the current price. This positioning supports the ongoing bearish trend.
Volume on the chart also shows fading interest during the pennant formation, followed by a small uptick on the breakdown candle. This shift indicates sellers are regaining control as bullish momentum weakens further.
If the price continues downward and reaches the projected target, it will have erased nearly all gains from its early May rally. Until the price reclaims the $0.70–$0.75 range and breaks above the EMA, bearish pressure will likely dominate.
Pi Network RSI Shows Weakening Momentum Below Neutral Zone
On May 30, 2025, the Relative Strength Index (RSI) chart for Pi Network (PI/USDT) on the 4-hour timeframe highlighted growing bearish momentum.
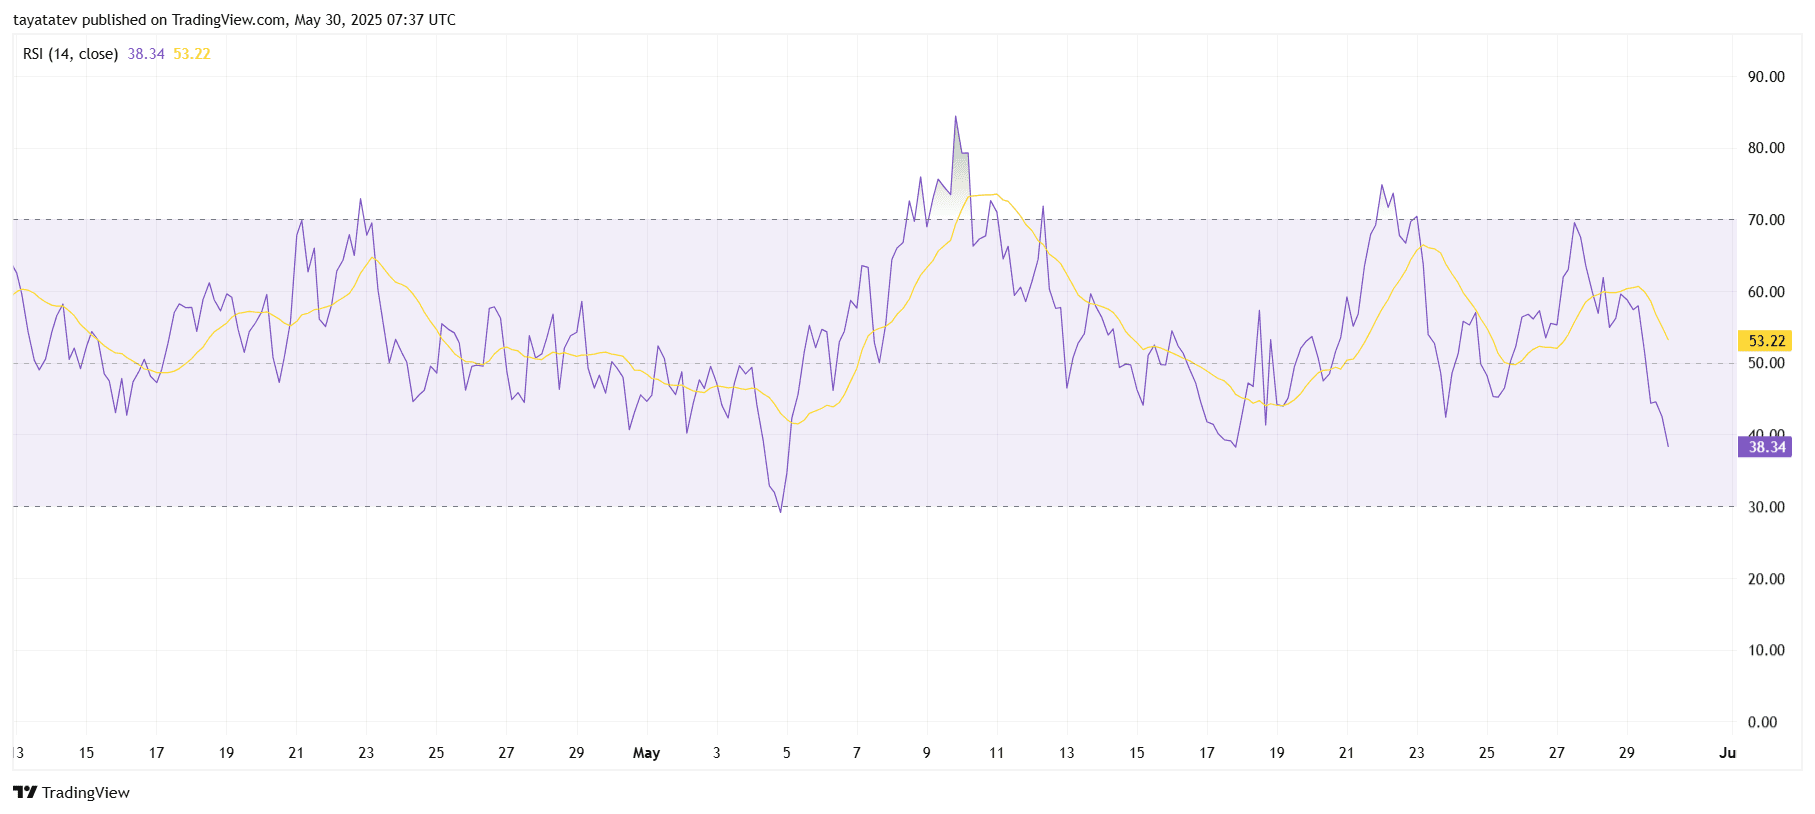
The Relative Strength Index (RSI) is a momentum indicator that measures the speed and change of price movements. It ranges from 0 to 100, with values above 70 considered overbought and below 30 considered oversold. The 50 level is the neutral midpoint.
Currently, the 14-period RSI value stands at 38.34, which places it well below the neutral 50 level. This reading shows that bearish momentum is increasing. The RSI has declined sharply over the past 48 hours, mirroring the price breakdown from the pennant structure.
Moreover, the RSI has crossed below its moving average (yellow line), which now sits at 53.22. This bearish crossover is a common confirmation of a potential continuation of downside pressure.
Throughout May, the RSI repeatedly failed to hold above 60, showing weak bullish follow-through even during short-term price rallies. Each failed attempt has been followed by a lower RSI peak, indicating diminishing strength from buyers.
Now, with the indicator trending toward the 30 threshold, sellers appear to be gaining further control. If the RSI breaks below 30, it may suggest the start of oversold conditions—but it would also confirm strong downward momentum.
Pi Network’s Bearish Momentum Gets Stronger as Trend Indicator Surges
Meanwhile, the Directional Movement Index (DMI) chart for Pi Network (PI/USDT) showed a clear shift toward stronger bearish momentum.
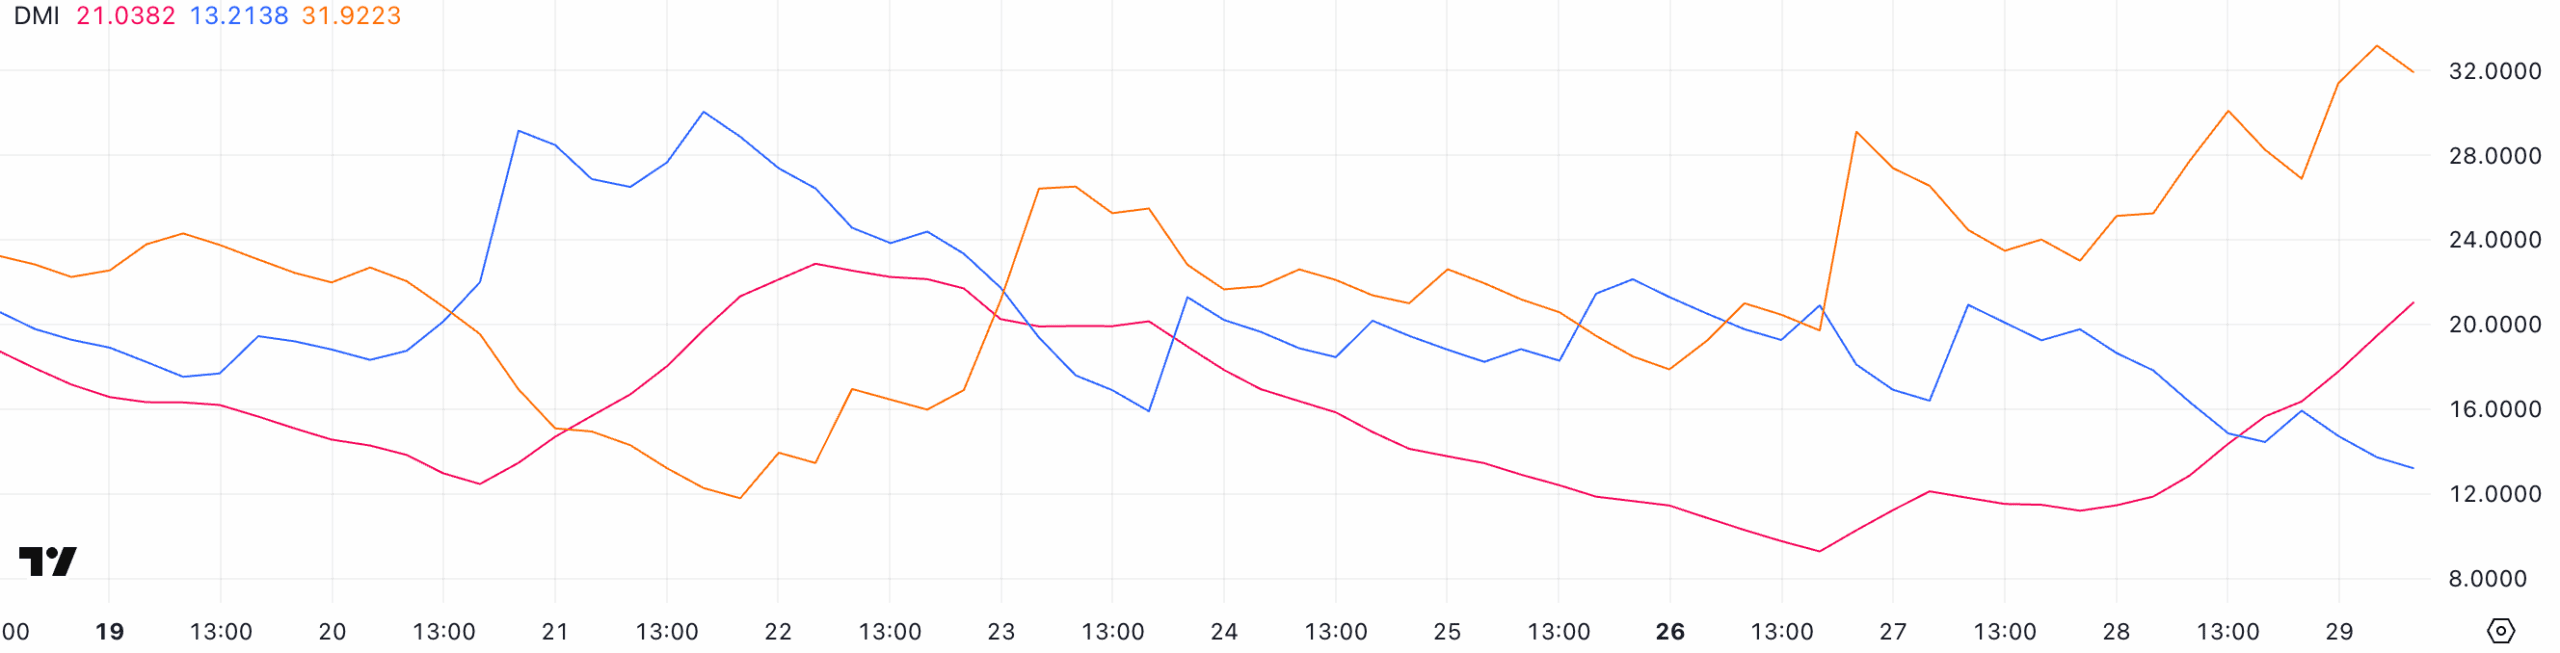
The Average Directional Index (ADX), which tracks trend strength, jumped from 11.46 to 21.03 in just one day. This move pushed the ADX above the key 20 level, signaling that a strong trend may now be forming. When ADX rises above 20, it usually means the market is starting to trend more clearly.
At the same time, the Positive Directional Indicator (+DI) dropped from 20.93 to 13.21. Meanwhile, the Negative Directional Indicator (−DI) surged from 23.48 to 31.92. This widening gap between the two indicators confirms that sellers are taking control.
When −DI climbs above +DI and the ADX also rises, it often points to a growing downtrend. In this case, the indicators clearly suggest that downward pressure on PI is increasing.
If this trend continues, the price could face even more losses in the short term. Traders and observers should monitor the price closely to see if it follows through with stronger bearish movement.
Pi Network Sees Strong Capital Outflow as CMF Hits Deep Negative
On May 30, 2025, the Chaikin Money Flow (CMF) for Pi Network (PI/USDT) dropped sharply to -0.20, showing strong selling pressure in the market.
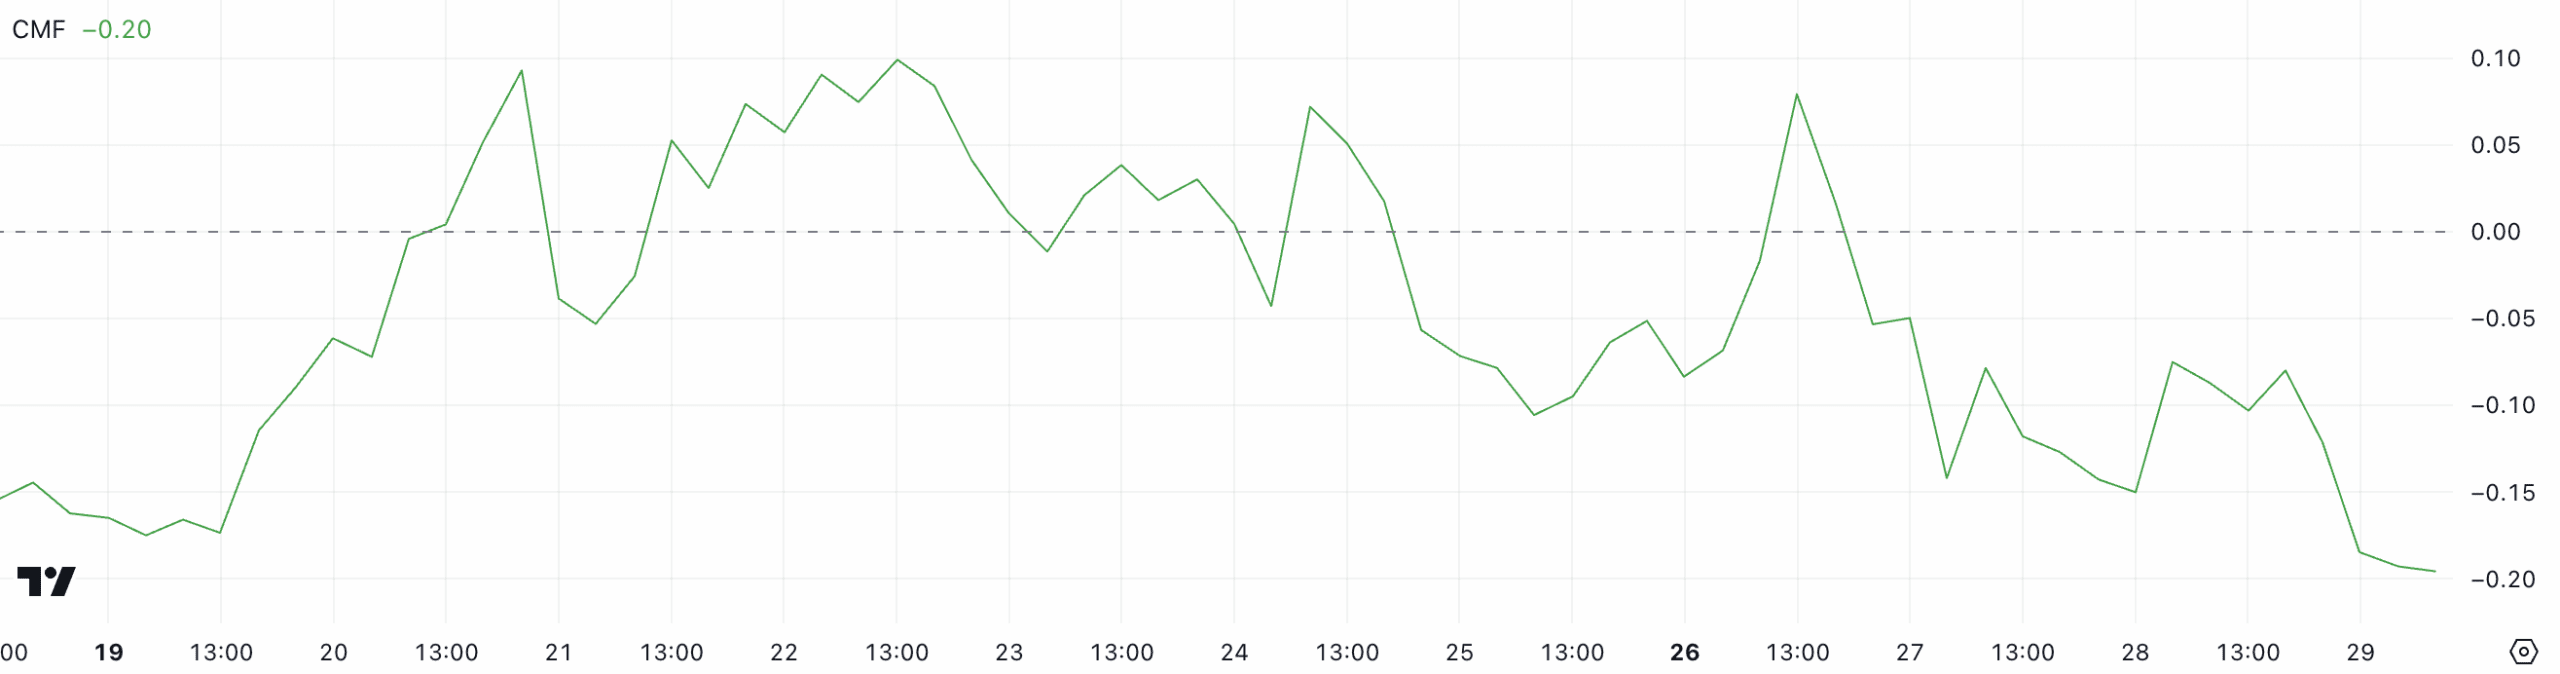
The CMF is a volume-based indicator that tracks money flow in and out of an asset over a period, usually 20 or 21 days. When CMF stays above 0, it shows buying pressure. When it drops below 0, it shows selling pressure. A value beyond ±0.10 is considered strong.
Just three days ago, the CMF was at 0.08. Then it slipped to -0.08. Now it sits at -0.20, its lowest level since May 17. This deep negative reading means sellers are now firmly in control, and capital is flowing out of the asset.
This drop comes as price action also moves lower, confirming bearish sentiment. With money leaving the market and no signs of reversal yet, the CMF aligns with other bearish indicators pointing to further downside risk.
