
ZachXBT, a known on-chain investigator, reported that Ripple co-founder Chris Larsen moved an estimated $140 million worth of XRP to wallets linked to exchanges over the past week.
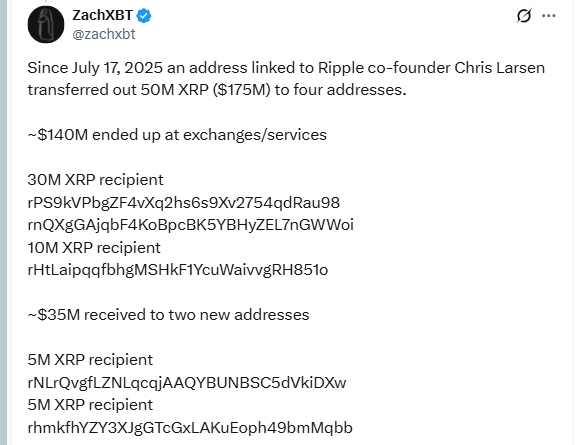
Starting on July 17, a wallet tied to Larsen transferred 50 million XRP, valued at approximately $161 million. Of this amount, three addresses connected to centralized trading platforms received around $140 million.
In addition to these transfers, 10 million XRP were sent to two new wallets with no prior transaction history, each now holding 5 million XRP.
Ripple executives have faced scrutiny for past XRP sales. In 2020, the U.S. Securities and Exchange Commission (SEC) accused CEO Brad Garlinghouse of personally selling $150 million worth of XRP between 2017 and 2020. Reports also indicated that Larsen and his wife sold roughly $450 million during the same period.
On July 18, Larsen reportedly sent another $30 million worth of XRP to Coinbase, just before XRP surged to a high of $3.65. Following a broader market correction, the token is currently trading near $3.10.
Market observers tracking insider activities have questioned the timing of Larsen’s latest transactions, but the motive behind these movements remains undisclosed.
XRP Forms Bearish Rising Wedge Pattern Ahead of Potential Breakdown
On July 25, 2025, XRP/ USDT formed a bearish rising wedge pattern on the 1-hour chart, according to a TradingView setup. This pattern typically emerges during a downtrend and represents a brief consolidation phase before prices continue to fall. It consists of two upward-sloping trendlines that converge, with declining volume confirming weakening momentum.
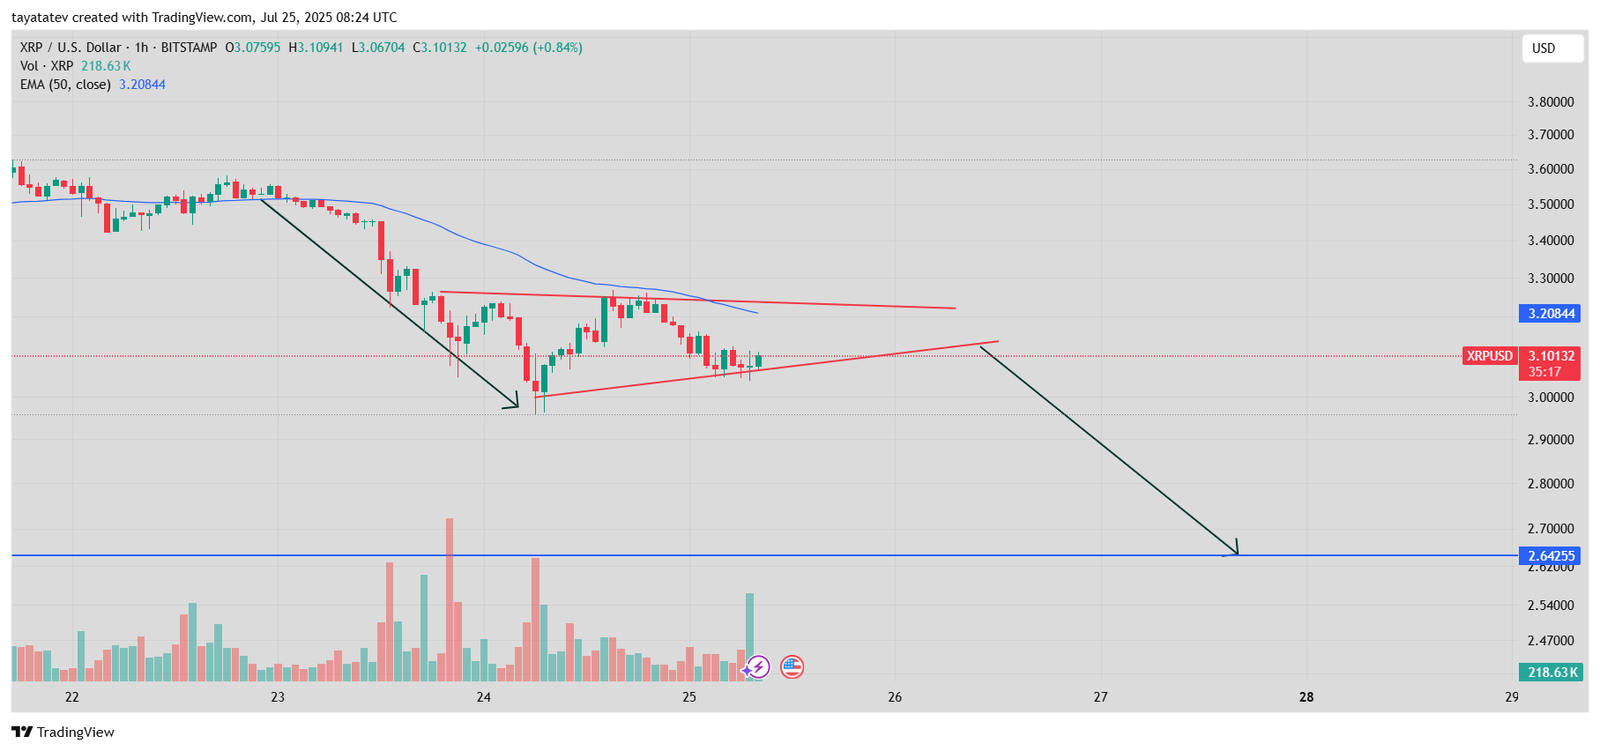
In this case, XRP trades near $3.10, while the wedge formation appears to tighten with lower highs and higher lows. The price continues to face resistance below the 50-period exponential moving average, currently near $3.21. Analysts widely recognize the rising wedge pattern as a bearish continuation signal, meaning the price often drops once the pattern breaks.
If confirmed, this setup suggests XRP could decline by approximately 17 percent from its current level. A measured target based on the pattern’s height indicates a potential drop toward $2.64, which matches the blue horizontal support marked on the chart.
As of now, XRP’s trading volume sits at around 218,630 XRP, showing signs of exhaustion during the consolidation phase. If sellers break below the wedge’s lower boundary with strong volume, the bearish outlook may play out swiftly. This would mark a continuation of the prior downtrend that began earlier in the week.
XRP RSI Struggles Below Neutral Zone, Momentum Weakens Further
Meanwhile, XRP’s Relative Strength Index (RSI) on the 1-hour chart showed values hovering near 42.65, indicating a lack of strong momentum. The chart, created using TradingView. also includes a 14-period moving average of the RSI, which currently reads 43.23, slightly above the raw RSI value.
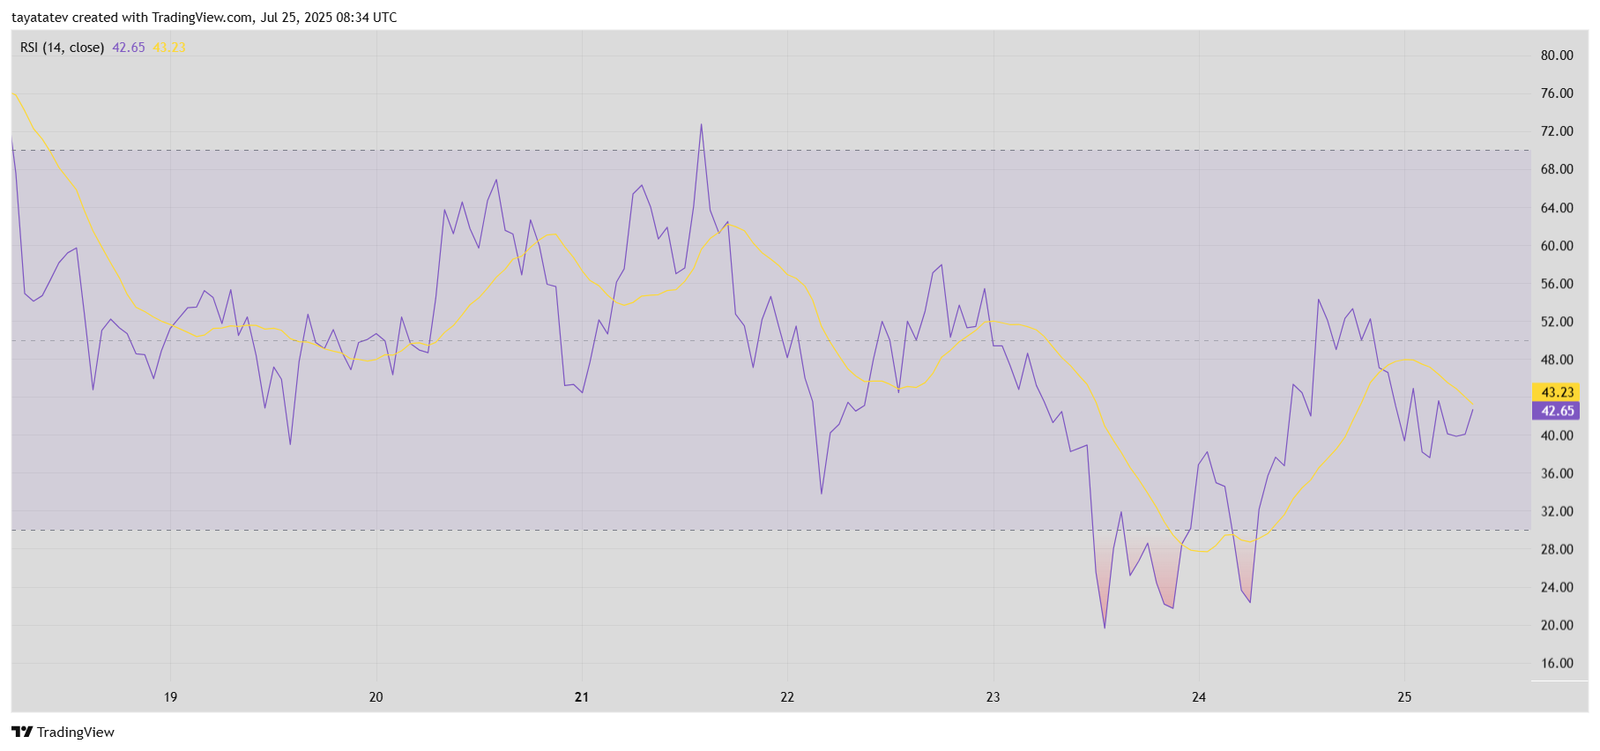
The RSI—Relative Strength Index—tracks the speed and change of price movements, offering clues about potential overbought or oversold conditions. An RSI below 50 suggests bearish momentum. In this case, XRP remains under that threshold, signaling sellers are still in control, though not aggressively.
Throughout the past few sessions, XRP attempted to recover from oversold territory near the 20–30 range, but each bounce failed to cross the neutral 50 level. This repeated rejection hints at weakening buying pressure and fading bullish interest.
Moreover, the RSI continues to trade sideways, lacking strong divergence or momentum spikes. If RSI dips back below 40 and sustains that level, further downside may follow, especially if confirmed by a breakdown in price structure. So far, the indicator reflects consolidation with a bearish tilt, aligning with the broader technical patterns visible on the price chart.
XRP Directional Movement Index Signals Weak Bullish Pressure as Trend Fades
On July 25, 2025, XRP’s Directional Movement Index (DMI) on the 1-hour chart reflected a weakening trend structure. The chart, generated on TradingView showed the Average Directional Index (ADX) at 40.84, the Positive Directional Indicator (+DI) at 11.17, and the Negative Directional Indicator (−DI) at 23.76.
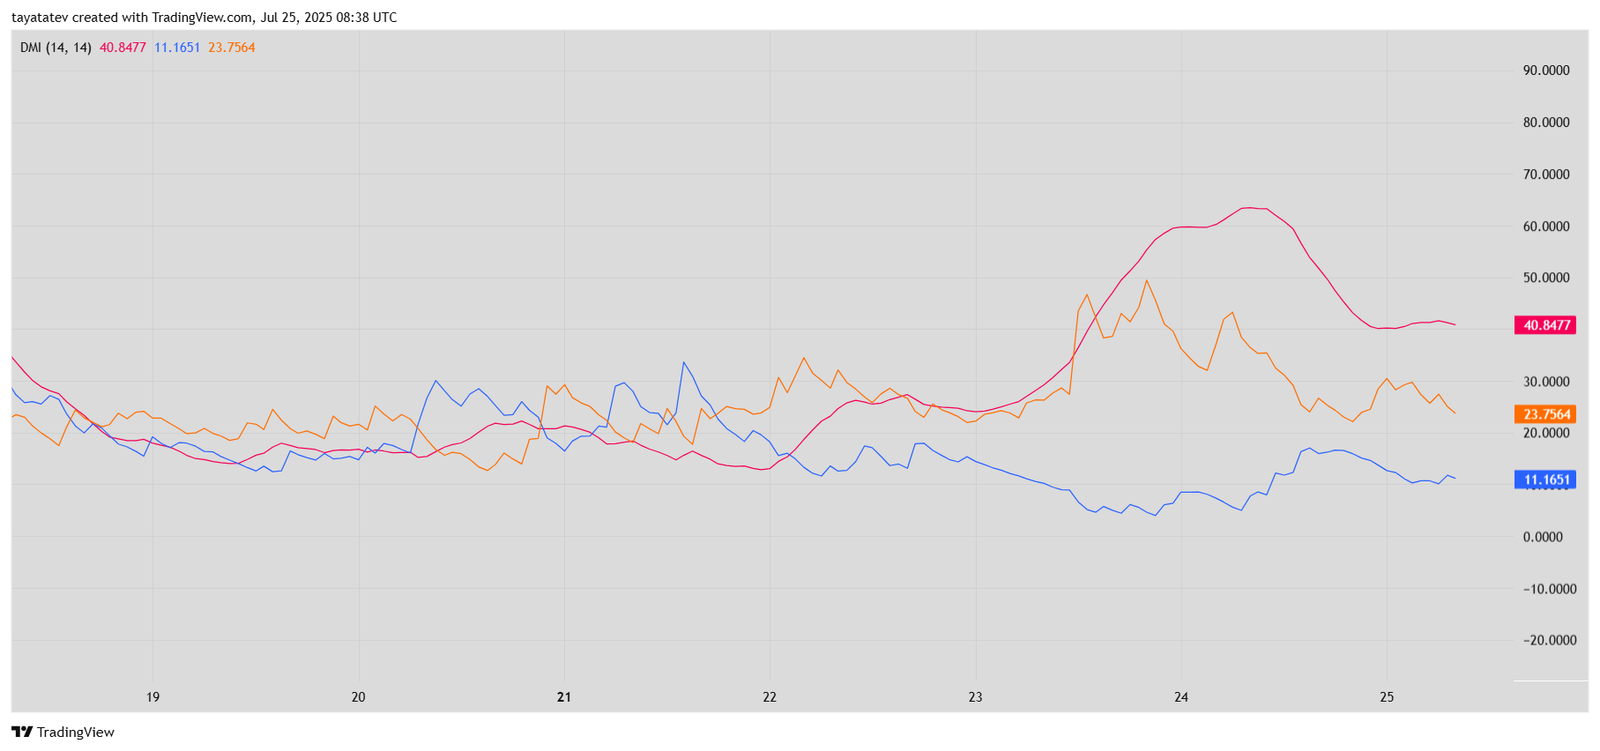
The DMI measures trend strength and direction. The ADX line, plotted in red, gauges the strength of the current trend regardless of its direction. Values above 25 indicate a strong trend. In this case, ADX above 40 confirms strong activity in recent sessions, but its recent flattening signals the trend may be losing steam.
Meanwhile, the orange line (−DI) continues to trade above the blue line (+DI), which means bearish momentum still dominates. Although −DI has slightly decreased from its July 24 peak, +DI remains suppressed, suggesting that bulls have not regained control.
Additionally, the growing gap between +DI and −DI across the last 48 hours reveals continued downward pressure, while the ADX deceleration suggests the bearish trend may be slowing, not reversing. Unless +DI crosses above −DI with rising ADX, the current downtrend remains intact.
XRP Balance of Power Shows Weak Buyer Control Below Neutral Level
XRP’s Balance of Power (BoP) indicator printed a reading of −0.08, suggesting that sellers still hold a slight advantage in the market. The chart, created using TradingView, shows the BoP fluctuating sharply between positive and negative territory over recent sessions, reflecting unstable control between bulls and bears.
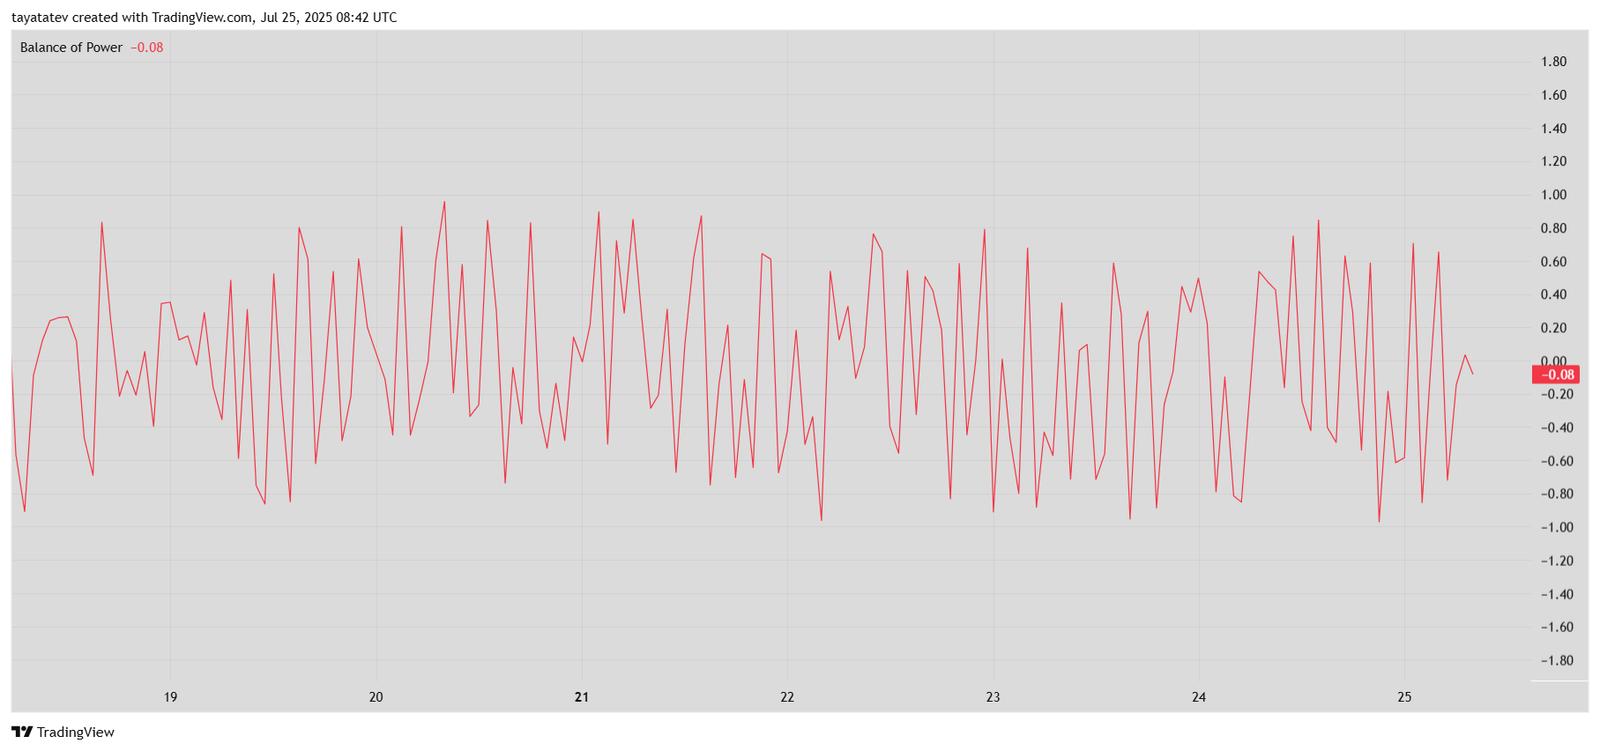
The Balance of Power measures the strength of buyers versus sellers by comparing the closing price to the trading range. Values above zero show bullish control, while values below zero signal bearish strength. In this case, the BoP hovering just below zero means that buying pressure remains weak and unable to dominate the market.
Throughout the last several days, the indicator has failed to maintain any sustained move above the neutral zone. Despite brief spikes into positive territory, they were quickly followed by sharp reversals. This volatility reveals hesitation among bulls and limited conviction from buyers.
Now that BoP sits near −0.08, XRP continues to trade in a fragile zone. Without a decisive break into positive territory, momentum may stay skewed toward the downside. This reinforces the bearish view already seen across other indicators, including RSI and the Directional Movement Index.
