
Nordic crypto exchange Safello increased its TAO holdings after selling one Bitcoin (BTC) as part of its ongoing crypto treasury strategy.
The company confirmed the transaction on Tuesday, marking its tenth treasury reallocation this year. Safello sold 1 BTC at €92,890 and used the proceeds to buy approximately 333 TAO tokens, paying an average of €278 per TAO.
This latest move follows earlier TAO purchases made in May and June 2025. Safello continues to follow a long-term dollar-cost averaging strategy, aimed at building a diversified crypto reserve focused on decentralized AI.
After the latest purchase, Safello’s treasury now holds around 2 BTC and 2,942 TAO.
Founded in 2013, Safello operates under the supervision of the Swedish Financial Supervisory Authority. It is also listed on Nasdaq First North Growth Market and serves more than 404,000 users across the Nordic region.
The company says its treasury allocation reflects growing institutional interest in TAO, the native token powering the Bittensor decentralized AI protocol.
TAO Forms Bullish Pennant, Targets 120% Rally to $939
On July 14, 2025, the TAO/USDT chart confirmed a bullish pennant pattern, signaling the potential for a sharp upside breakout. A bullish pennant is a continuation pattern that forms after a strong upward move, followed by a brief period of consolidation between converging trendlines. This structure usually ends with another upward surge once resistance breaks.

TAO’s price reached $422.4 during Monday’s session, rising more than 8% on the day. The pattern began forming in early May, after a steep rally pushed the price above $400. Since then, TAO traded sideways within two red converging lines, creating the pennant shape.
The current breakout above the upper trendline suggests that buyers are gaining strength. If the breakout confirms, TAO may rally as much as 120%, setting a potential target near $939.5.
This projection follows the classic bullish pennant structure, where the breakout typically mirrors the length of the previous move (known as the flagpole). Volume also increased during the breakout attempt, reinforcing the bullish signal.
The 50-day exponential moving average (EMA), currently at $360.7, now serves as strong support. As long as the price holds above this level, momentum could build further.
If the breakout holds, TAO may enter a new bullish phase. The next price reaction will determine whether the move sustains or fades.
TAO RSI Nears Overbought as Momentum Builds on July 14
The Relative Strength Index (RSI) for TAO/USDT reached 67.64 on July 14, 2025, indicating strong bullish momentum. The RSI line, shown in purple, has sharply risen from below 40 over the past two weeks. It is now approaching the 70 level, which marks the start of the overbought zone.
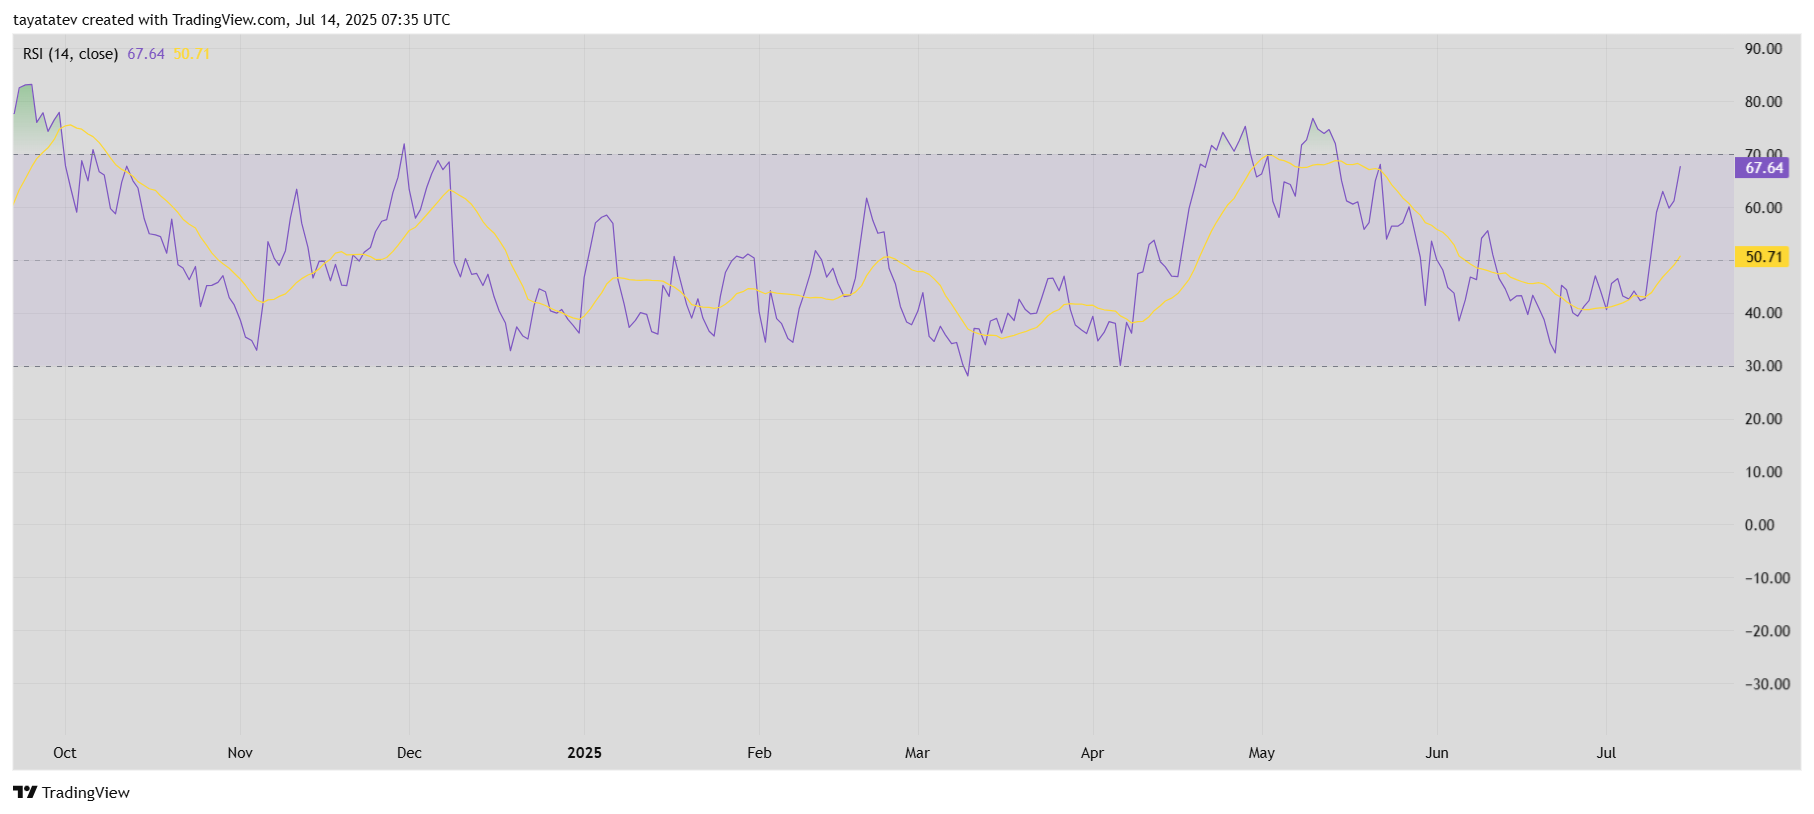
The yellow signal line (RSI moving average) sits lower at 50.71, confirming upward acceleration. When the RSI value rises significantly above the signal line, it suggests increasing buying pressure.
In technical terms, the RSI (Relative Strength Index) is a momentum oscillator that measures the speed and change of price movements. Values above 70 often indicate overbought conditions, while values under 30 suggest oversold status.
With RSI nearing 70 but not yet above it, TAO may still have room to move upward. However, if it crosses that level without consolidation, it could signal a short-term cooling period or potential for correction.
For now, the momentum supports the earlier pennant breakout. If RSI enters and holds the overbought zone while price rises steadily, it could reinforce the case for a continuation toward the projected $939.5 target.
TAO MACD Flashes Bullish Signal as Momentum Builds on July 14
The Moving Average Convergence Divergence (MACD) indicator for TAO/USDT turned bullish on July 14, 2025, as shown in the latest 1-day chart. The MACD line (blue) crossed above the signal line (orange), reaching 11.8 vs. 10.0, while the histogram flipped green and rose sharply.
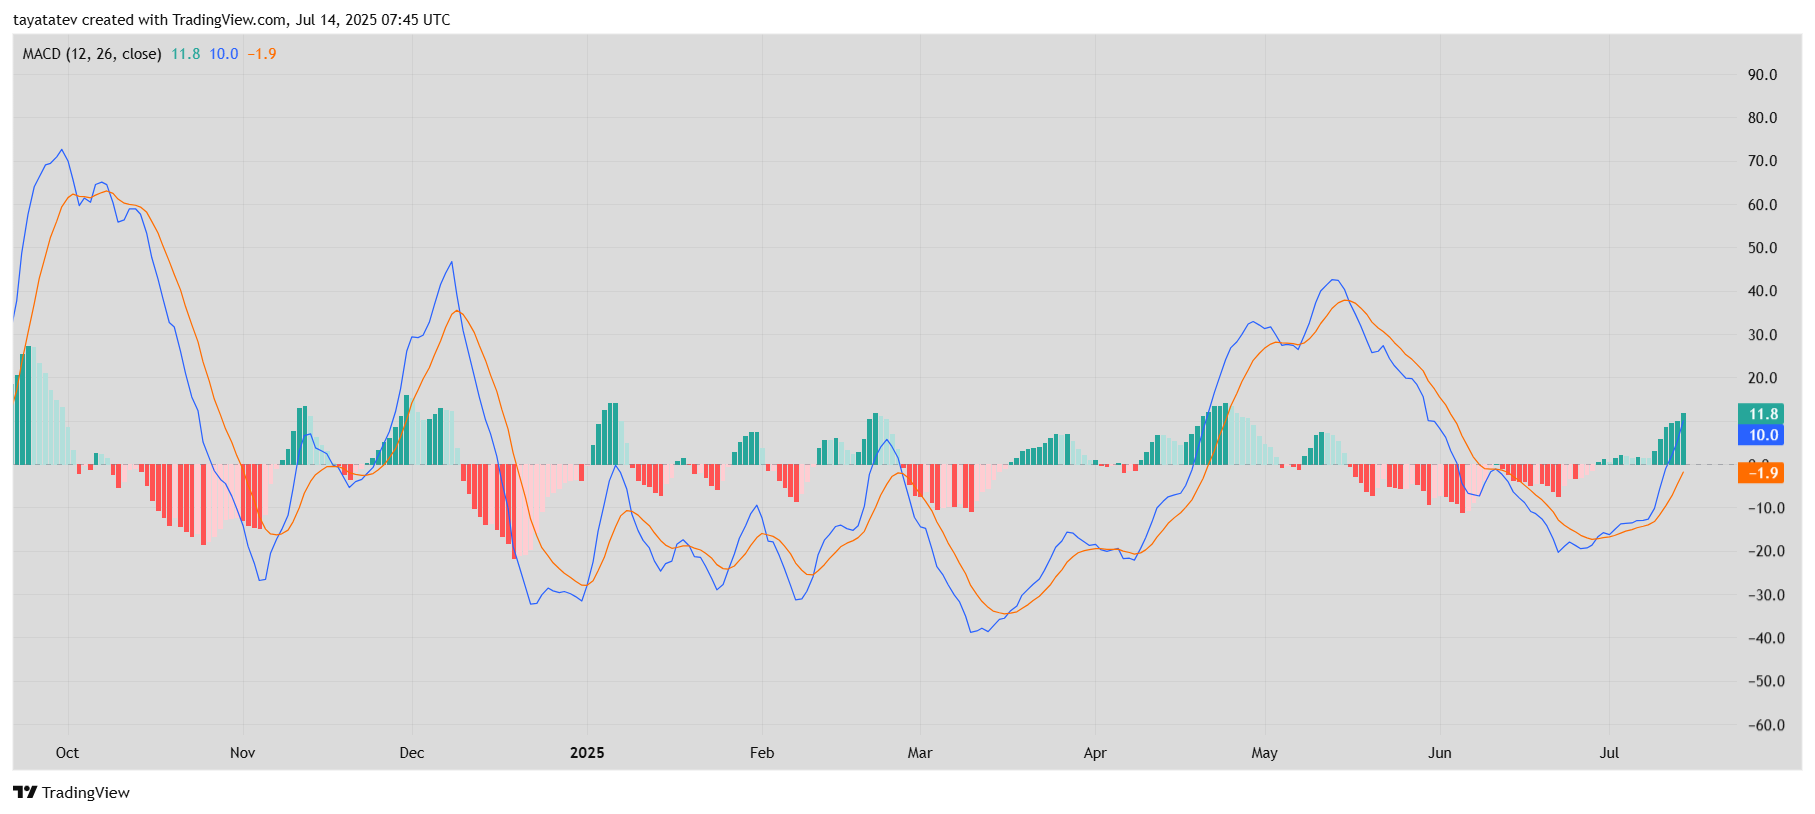
This crossover indicates growing bullish momentum. The MACD histogram now prints increasing green bars, suggesting a widening gap between the MACD and signal lines. These bars measure the strength and direction of the price trend.
The MACD (12, 26, 9) calculates the difference between two exponential moving averages — the 12-period EMA and 26-period EMA — and plots that against a 9-period signal line. When the MACD line moves above the signal line, it often marks a shift toward a stronger uptrend.
This crossover supports the earlier breakout seen on TAO’s price chart and aligns with the RSI approaching the overbought zone. The sharp histogram rise reflects rising buyer demand and confirms a trend reversal from the bearish MACD cycle that lasted through June.
With MACD now above zero and momentum increasing, technical conditions favor continued upward movement. TAO appears to be in the early phase of a broader bullish swing.
TAO’s Balance of Power Hits 0.82, Signals Strong Buyer Control on July 14
On July 14, 2025, the Balance of Power (BOP) indicator for TAO/USDT climbed to 0.82, confirming that buyers currently dominate the market. This surge in the BOP reading reflects a clear shift in control from neutral territory to strong bullish momentum.

The Balance of Power measures the relative strength of buyers versus sellers. Values close to +1.0 indicate strong buyer control, while values near -1.0 show strong seller dominance. A neutral or sideways market usually hovers near zero.
Over the past two weeks, the BOP line has steadily moved higher, flipping from negative values toward the upper end of the scale. This move aligns with the rising volume and price seen in the broader TAO breakout structure. It also supports the bullish signals from the RSI and MACD indicators.
Such a high BOP reading typically appears when buying pressure continues throughout the trading day, often closing prices near their highs. This condition reinforces expectations for upward continuation, especially after a confirmed bullish pennant breakout.
As long as the BOP stays elevated, the momentum favors further gains in TAO.
