
The United States Securities and Exchange Commission (SEC) has extended its review of the proposed Grayscale Litecoin ETF, pushing the decision deadline to October 10, 2025. The agency said it needs additional time to evaluate the rule change and address regulatory concerns, adding uncertainty to the approval timeline.
The proposal aims to convert the existing Grayscale Litecoin Trust into a spot exchange-traded fund, providing institutional and retail investors with regulated access to Litecoin through traditional financial markets. This conversion would mark a significant step toward broader integration of crypto assets into mainstream investment products.
The delay underscores the SEC’s cautious stance on crypto-based funds, even as demand for regulated digital asset exposure grows. Market analysts noted that an eventual approval could attract new inflows and increase Litecoin’s visibility among traditional investors. However, the extended review signals that regulatory scrutiny over digital asset ETFs remains intense.
Litecoin Forms Bullish Flag Pattern with 31% Upside Potential
The LitecoinLTC/USD price chart, created on August 1, 2025, displays a bullish flag pattern, which is a continuation pattern that typically follows a strong upward move and signals the potential for further gains if confirmed.

LTC is trading at $104.87 and has been consolidating within parallel downward-sloping trendlines after a sharp rally earlier in July. This structure, combined with the 50-period Exponential Moving Average (EMA) at $109.89, indicates ongoing bullish momentum despite the short-term pullback.
If the bullish flag confirms with a breakout above the upper trendline, Litecoin’s price could rise by 31% from the current level, targeting approximately $137.59. The projected move aligns with the height of the previous rally, measured and applied from the breakout point.
Volume analysis shows a decline during the consolidation phase, which supports the validity of this pattern. A surge in trading activity during a breakout would strengthen the case for upward continuation. With price currently near the lower channel support, any bounce from this zone could accelerate a test of the upper boundary, setting up the breakout scenario toward the $137.59 target.
Litecoin Balance of Power Shows Slight Bearish Tilt
The Litecoin (LTC) Balance of Power (BOP) chart, created on August 1, 2025, indicates a reading of -0.07, signaling a slight bearish tilt in market momentum. The Balance of Power measures the strength of buying and selling pressure by comparing price movements to volume. A negative value suggests that sellers currently hold marginal control over price action.
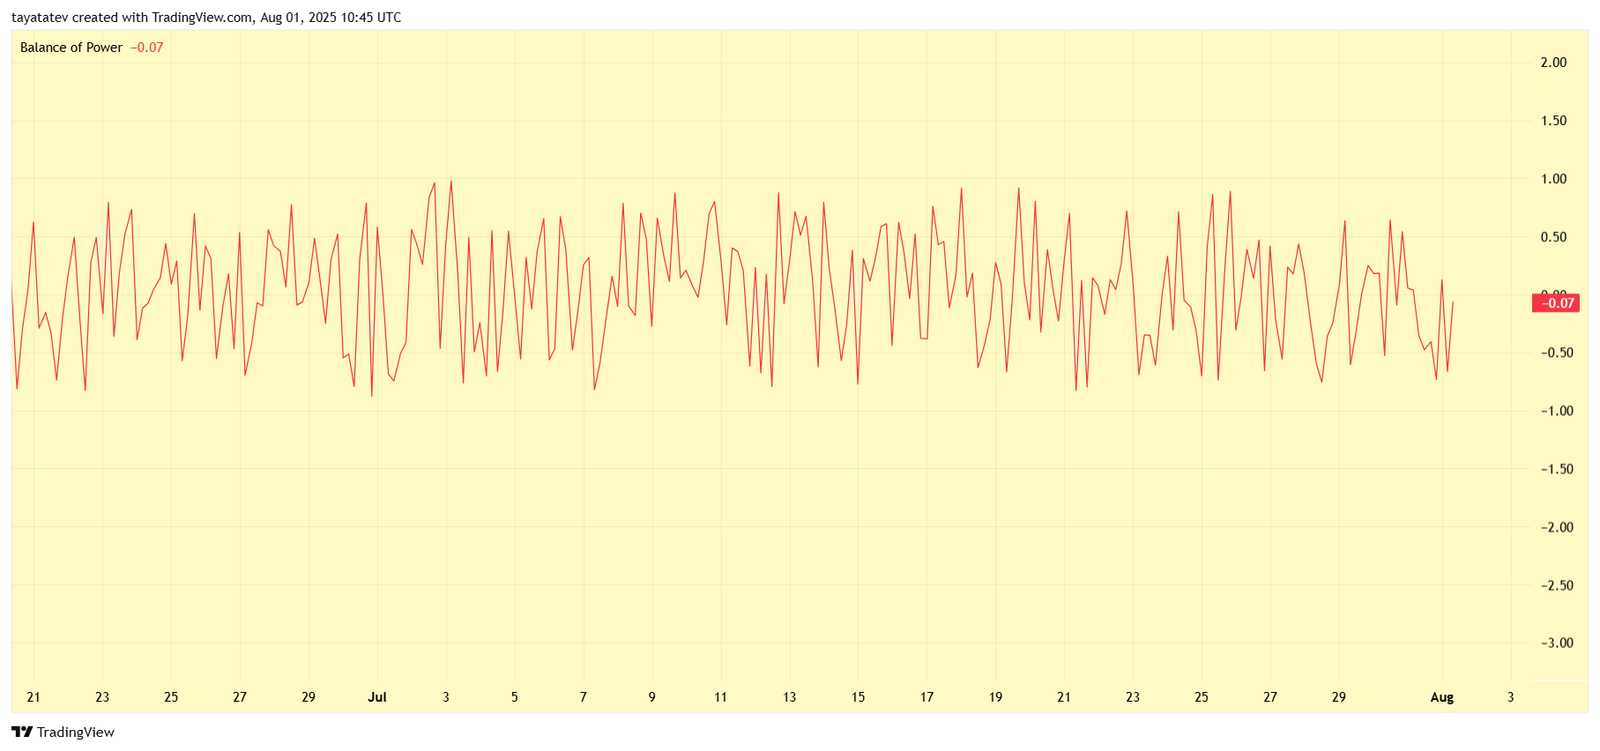
Throughout late July and into early August, the BOP has fluctuated near neutral levels, showing rapid shifts between mild buying and selling dominance. This consistent oscillation around zero reflects indecision, with neither bulls nor bears sustaining momentum for an extended period.
Given its current position, this indicator supports the ongoing consolidation phase seen in Litecoin’s price. While a negative BOP points to temporary selling strength, its proximity to the zero line implies that market sentiment remains balanced and could shift quickly. If buying pressure increases and the BOP turns positive, it would confirm alignment with the bullish flag breakout pattern noted on Litecoin’s price chart, reinforcing the potential upside target of $137.59.
Litecoin RSI Near Oversold Signals Potential Reversal Zone
The Litecoin (LTC) Relative Strength Index (RSI) chart, created on August 1, 2025, shows the RSI at 32.10, approaching the oversold threshold of 30. The RSI measures the speed and magnitude of price changes to evaluate momentum, with values below 30 typically indicating oversold conditions and a possible price rebound.
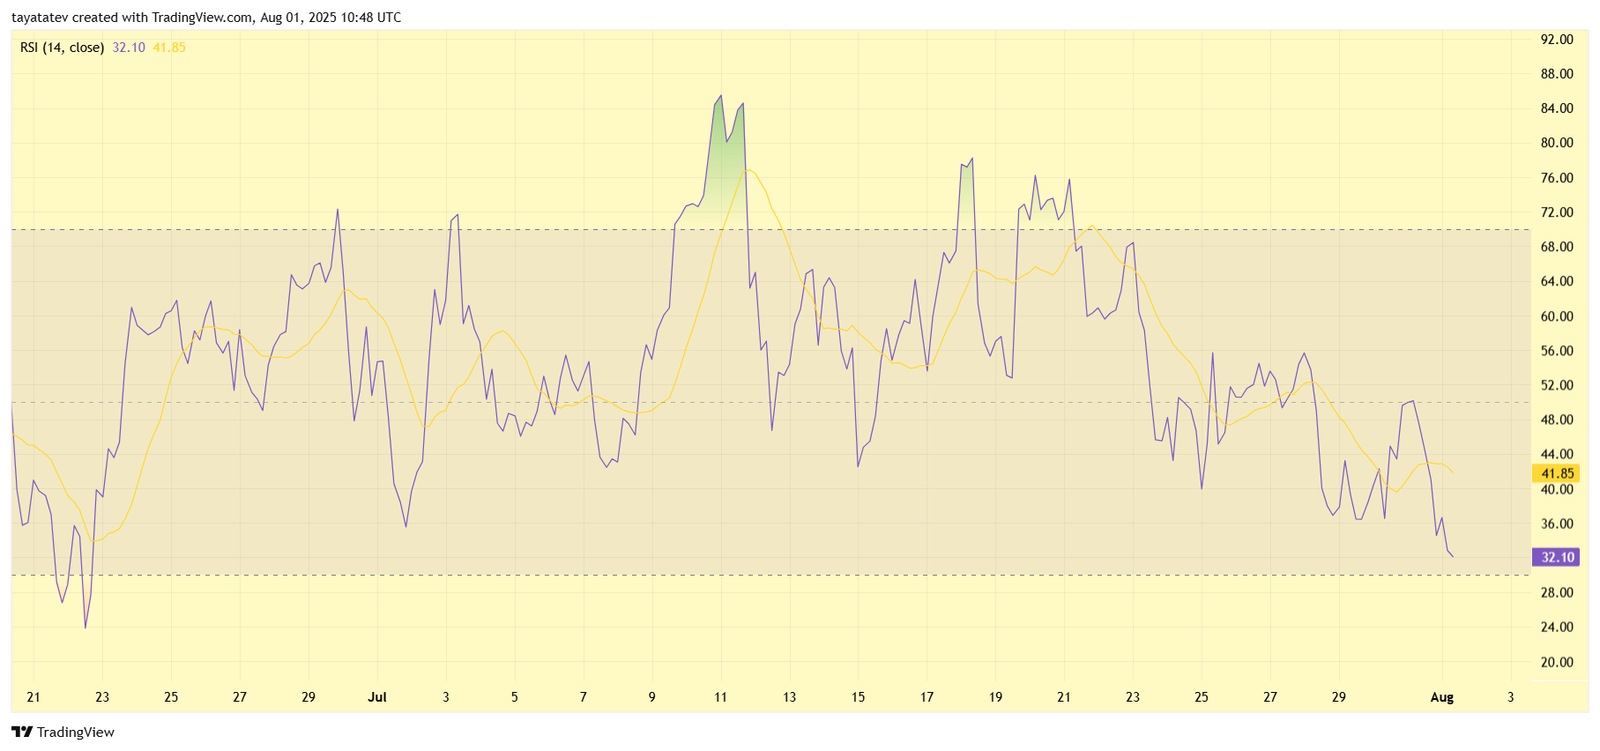
The RSI has trended downward since mid-July, aligning with LTC’s pullback within the bullish flag pattern. This weakening momentum suggests that sellers have been in control, but the proximity to oversold territory signals that downward pressure may be losing strength. Additionally, the RSI’s moving average, currently at 41.85, remains above the RSI line, reinforcing short-term bearish momentum while highlighting room for a potential reversal if buying strength returns.
If the RSI drops slightly lower and then rebounds, it would likely coincide with a breakout from the bullish flag pattern seen on the price chart. Such a shift could validate the projected 31% upside target to $137.59, especially if accompanied by rising trading volume and a positive turn in other momentum indicators. This alignment would confirm renewed buying pressure and strengthen the case for an upward move.
Litecoin MACD Confirms Bearish Momentum but Signals Possible Reversal Zone
The Litecoin (LTC) Moving Average Convergence Divergence (MACD) chart, created on August 1, 2025, shows the MACD line at -1.46 below the signal line at -1.09, while the histogram prints red bars at -0.37. The MACD measures the relationship between two moving averages of price to assess momentum, and its current positioning indicates ongoing bearish momentum.

The downward crossover that occurred in late July has kept selling pressure dominant, reflected in a series of negative histogram bars. This trend aligns with LTC’s consolidation within the bullish flag pattern and confirms short-term weakness. However, the histogram has begun to contract slightly, suggesting that selling momentum is slowing. This narrowing often precedes a potential reversal or a crossover back toward bullish territory.
If the MACD line moves upward and crosses above the signal line, it would generate a bullish signal. Combined with Litecoin’s oversold RSI and the bullish flag structure, this reversal could confirm a breakout and drive price toward the $137.59 target, representing a projected 31% upside from current levels. A shift in histogram color from red to green would further validate renewed buying strength.
