
Sei now hosts tokens that represent shares in BlackRock’s ICS U.S. Dollar Liquidity Fund and Brevan Howard’s Master Fund. KAIO, a tokenization platform, launched the products on Oct. 8 (U.S.) / Oct. 9 (Asia), bringing on-chain subscription, redemption, and reporting for eligible investors. The parties framed the move as expanding institutional-grade real-world assets on Sei.
What launched on Sei
KAIO introduced a token linked to BlackRock’s ICS U.S. Dollar Liquidity Fund on the Sei Network. In parallel, it enabled access to a token tied to the Brevan Howard Master Fund. Both instruments are live under KAIO’s infrastructure and run on Sei’s base layer.
The announcement states that qualified market participants can use KAIO to handle fund workflows directly on-chain. Those workflows include creating and redeeming positions and receiving programmatic reporting. The rollout positions the products for use inside compliant venues that connect to Sei.
Moreover, coverage from industry outlets and wire services corroborates the timing and the scope of the launch. Reports list the same pair of funds and confirm Sei as the target network for KAIO’s latest deployment.
How access and usage work
KAIO’s materials indicate that access is limited to institutional and accredited investors. The platform handles identity checks and eligibility before it admits participants to subscribe or redeem the tokens. Therefore, the products seek to keep traditional compliance while using on-chain rails.
Once admitted, investors can subscribe and redeem on-chain, then route holdings into approved applications. As reports note, the design aims to let the tokens serve in roles such as collateral or liquidity reserves where policy allows. That framing appears consistently across initial coverage.
Additionally, third-party summaries mirror the official description and emphasize operational features rather than price. They reference the same fund names, the Sei deployment, and KAIO’s control plane for compliance.
Why this matters for Sei’s infrastructure
Sei recently made Chainlink Data Streams its preferred oracle infrastructure. The integration delivers low-latency feeds intended for high-frequency and capital-markets use cases. It also gives builders a standardized path to consume verified data.
Because of that change, tokenized fund activity can plug into oracle services built for trading and risk systems. In practice, this supports applications that need fast updates and auditability. Public posts from Sei and Chainlink confirm the status of Data Streams on Sei.
Finally, Sei’s ecosystem roundup reinforces the same point: the network is layering regulated-asset access on top of market-data infrastructure. Therefore, the KAIO launch arrives alongside recent core upgrades and ecosystem announcements, not as an isolated event.
SEI chart thesis and levels
CryptoPatel published a SEI/USDT five-day chart that outlines a path toward $2, calling that mark a key target in the current cycle. He states SEI is up about 140% from his initial entry and frames an 800% gain from current levels as possible if the structure holds. The chart highlights an “accumulation” band near $0.19–$0.21 and a “re-entry zone” around $0.28–$0.32, suggesting buyers defended those areas before the latest sideways range.
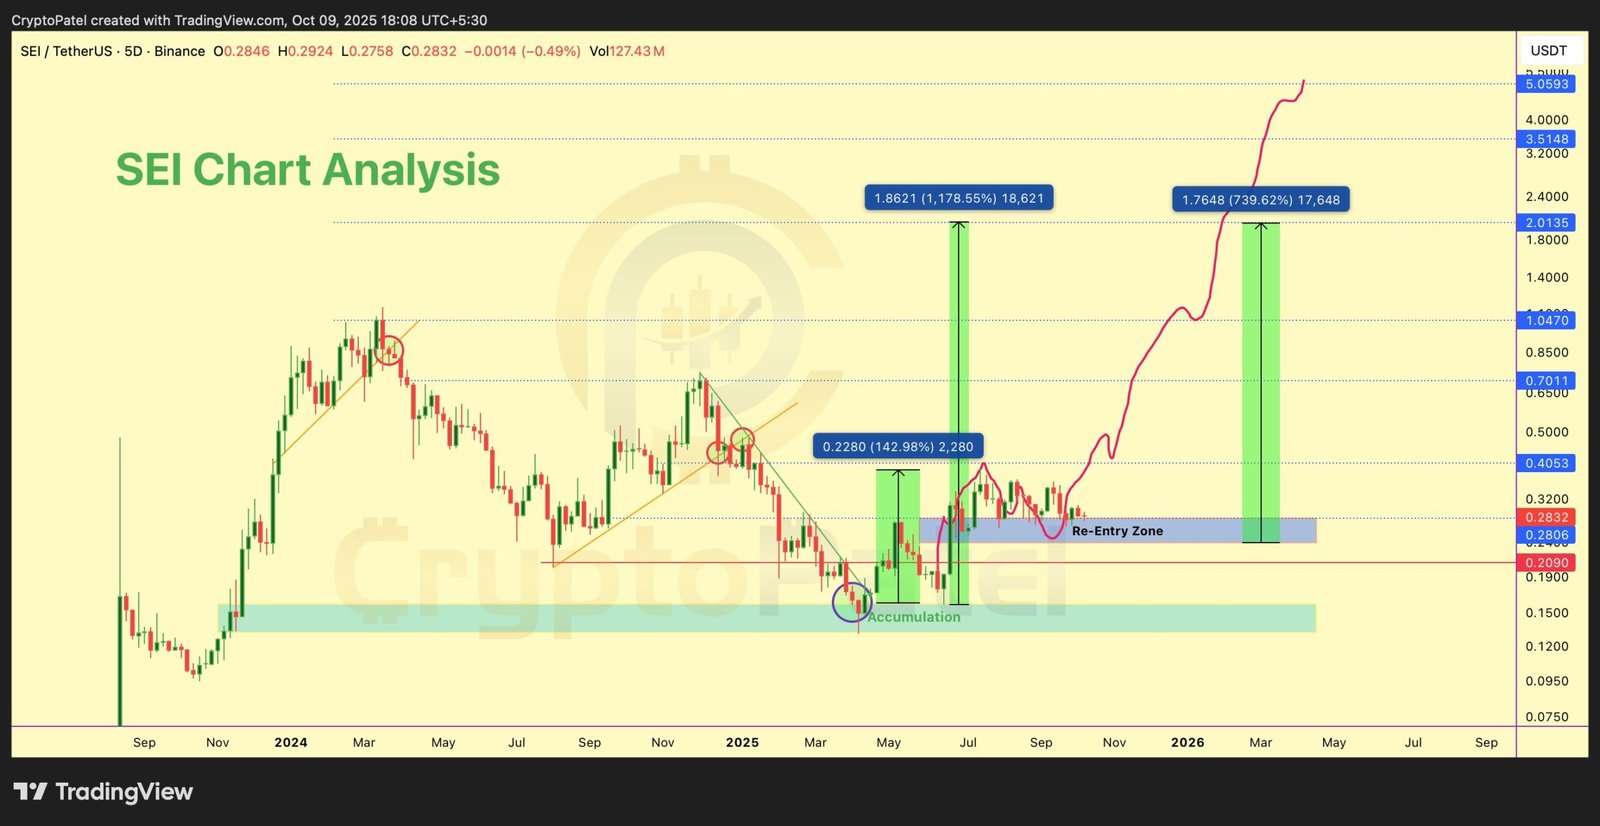
The visual shows a completed downtrend break, followed by a higher-low base and a broad consolidation. It plots stepwise resistance shelves at roughly $0.4053, $0.7011, $1.0470, $2.0135, $3.5148, and $5.0593, which are labeled on the right axis. In addition, two measured-move boxes appear on the chart: one referencing a prior rebound of ~143% and another projecting multi-hundred-percent extensions. In technical terms, a “bullish structure” means price forms higher lows and then reclaims former ceilings as support; a “measured move” estimates upside by repeating the size of a prior impulse.
The red path on the chart sketches a stair-step advance into Q1–Q2 2026, with interim pauses near the marked levels and the $2 handle serving as a milestone. However, the same drawing implies invalidation if price loses the re-entry zone and returns to the green accumulation band, where the setup would need rebuilding. As always, this is one analyst’s view based on support-resistance mapping and trend behavior; outcomes depend on liquidity, news flow, and how the market reacts around each shelf.
SEI Elliott-wave roadmap and Fibonacci targets
The chart presents a high-time-frame Elliott-wave thesis that projects a breakout from the current flag, a mid-trend pause, and then an extension into a higher target zone. The path labels an ABC decline into mid-2025, followed by an impulsive advance that set a higher low and formed a small a-b-c pullback inside a tightening flag. Fibonacci extensions mark successive objectives: ~2.272 near $0.75, ~2.618 near $0.92, ~3.0 near $1.23, and ~3.618 near $1.66. The green boxes highlight two checkpoints: a nearer box around the first extension cluster, and a larger destination band spanning roughly $1.2–$1.7.
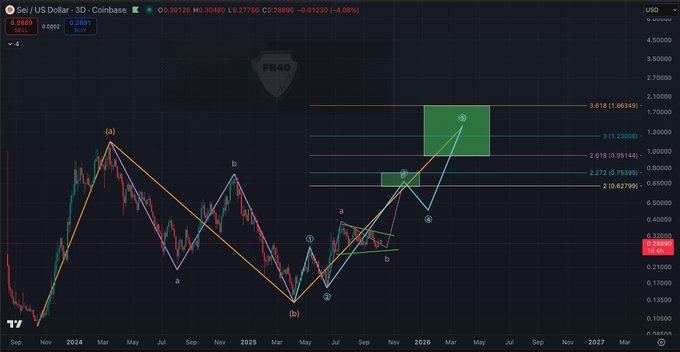
Structure comes first in this view. After the (b) low, price carved a series of higher highs and higher lows, then compressed. A clean break above the flag’s upper trendline would confirm continuity of the impulse and open the way toward the ~$0.75–$0.92 Fibonacci zone. As mapped, the plan anticipates an initial reach into that box, a corrective wave that revisits breakout territory, and a subsequent leg aiming at the $1.23–$1.66 band. In practice, the count remains constructive as long as pullbacks hold above the prior swing low and reclaimed resistances act as support.
Risk and invalidation sit below the flag and the last higher low. Losing those levels would weaken the impulse view and shift focus back to the mid-$0.20s demand where the structure was rebuilt. Conversely, reactions at each Fibonacci tier matter: strong acceptance above ~$0.92 would strengthen the case for the larger green zone; rejection there would reinforce the corrective step the path already sketches. As always, volume on the breakout, how price behaves on retests, and whether former ceilings hold as floors will determine whether this roadmap plays out.
