SEI Falling Wedge Sets 20% Breakout Target as Bears Dominate Momentum Indicators
SHARE
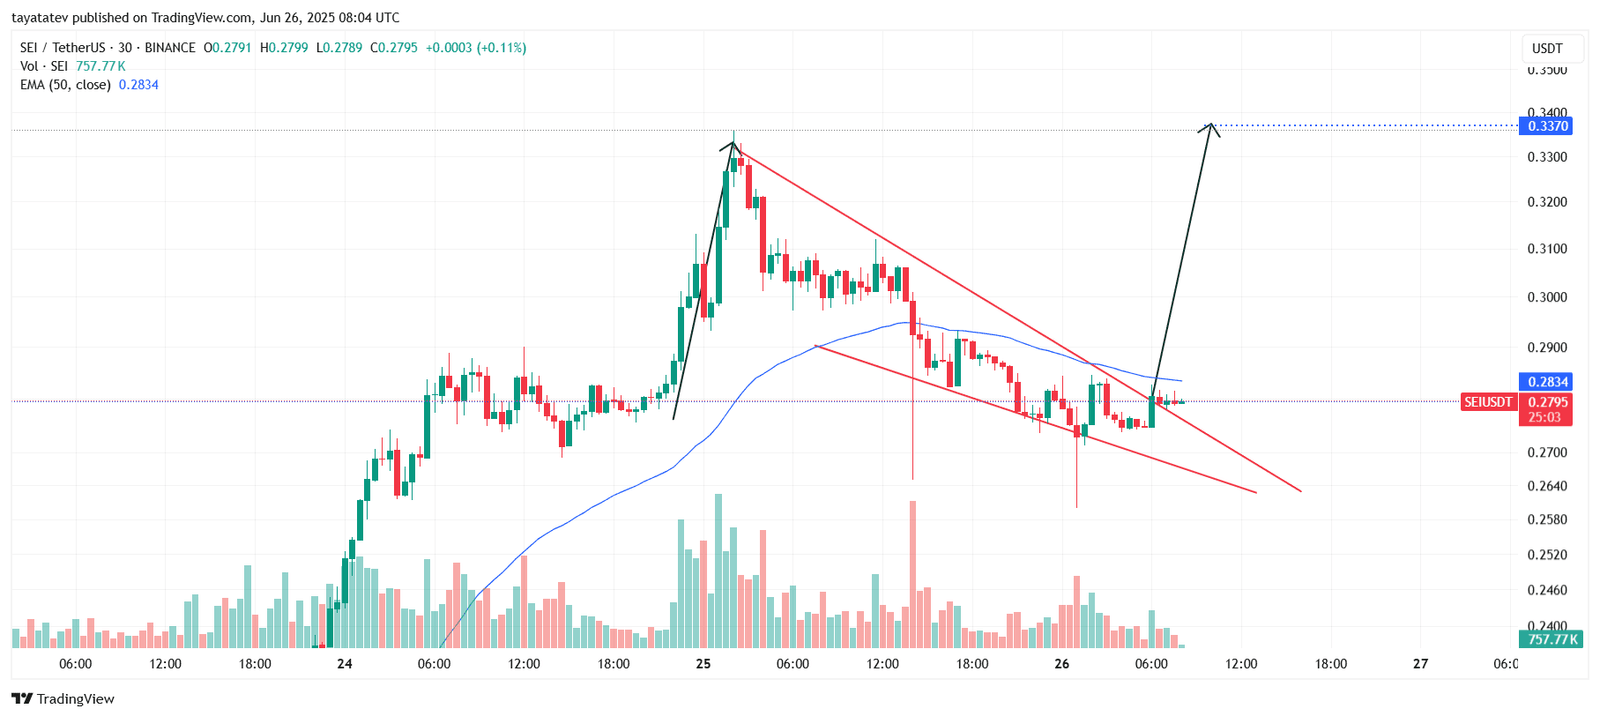
On June 26, 2025, the SEI to Tether (USDT) trading pair formed a falling wedge pattern on the 30-minute chart. This structure began after the sharp price spike on June 25 and developed as the price moved with lower highs and lower lows inside two converging downward-sloping red lines.
A falling wedge pattern is a bullish reversal setup that forms when an asset’s price consolidates between two downward-sloping and converging trendlines. It suggests weakening selling pressure and often leads to a breakout in the upward direction.
- Advertisement -
At the time of writing, SEI trades at $0.2795. The price sits just below the 50-period Exponential Moving Average (EMA), currently positioned at $0.2834. An exponential moving average gives more weight to recent prices and is used to identify trend direction and potential support or resistance levels.
If SEI breaks above both the wedge and the 50 EMA with strong volume, the breakout may confirm. In that case, the price could rise by approximately 20%, reaching the projected target of $0.3370.
Volume on the breakout leg shows early signs of recovery, adding support to the potential move. Traders are likely monitoring a close above $0.2834 to validate bullish continuation.
- Advertisement -
SEI/USDT RSI Signals Weak Momentum With Possible Shift
The Relative Strength Index (RSI) for SEI/USDT is currently at 44.78, with its 14-period simple moving average at 43.72. This reading comes from the 30-minute chart published on June 26, 2025.
SEI/USDT RSI Momentum. Source: TradingView
The RSI, a momentum indicator that ranges from 0 to 100, measures the strength and speed of recent price changes. Since it remains below the neutral 50 line, the market still shows weak momentum, leaning slightly bearish. However, the RSI has just crossed above its moving average, which may indicate a possible short-term shift toward bullish pressure. There’s no visible divergence between RSI and price, so momentum aligns with price action for now. A continued rise above 50 would further confirm a breakout if paired with strong price movement.
SEI/USDT Balance of Power Confirms Bearish Pressure
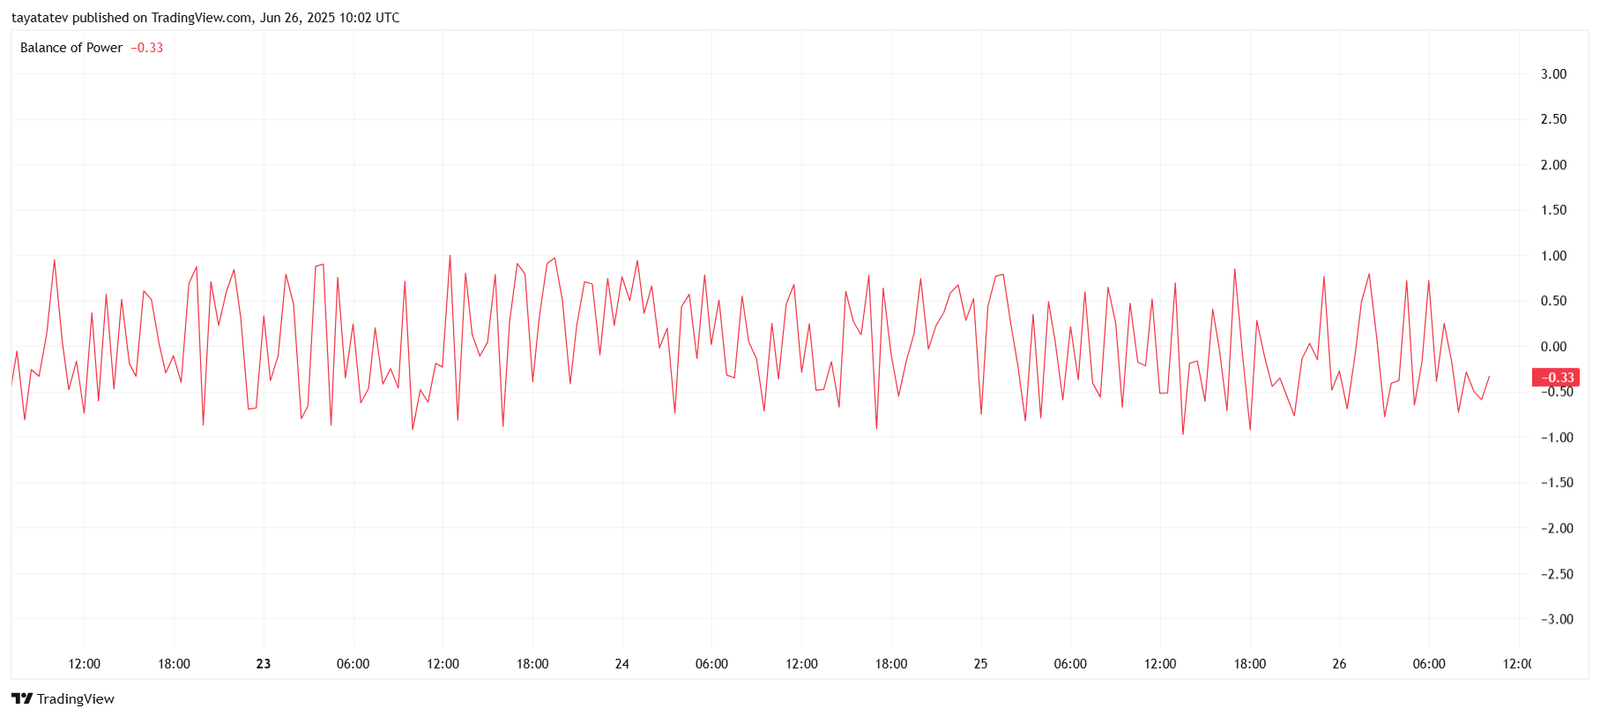
The Balance of Power (BoP) indicator for SEI/USDT reads –0.33, showing that selling pressure dominates the market. The Balance of Power is a technical indicator used to assess who controls the price—buyers or sellers—by comparing the closing price with the trading range. When BoP values are above zero, it means buyers are stronger. When values are below zero, sellers are stronger.
SEI/USDT Balance of Power. Source: TradingView
In this case, the indicator stays below zero across most of the chart. This shows that sellers have been consistently stronger than buyers over the past few days. Even during brief upward moves, the BoP failed to rise and hold above zero, which confirms that buying strength has remained weak.
The current reading of –0.33 signals that downward momentum still exists. To shift toward a bullish outlook, the BoP needs to move above zero and remain stable in positive territory. Until then, sellers remain in control of the SEI/USDT short-term trend.
SEI/USDT DMI Indicator Shows Weak Trend Strength
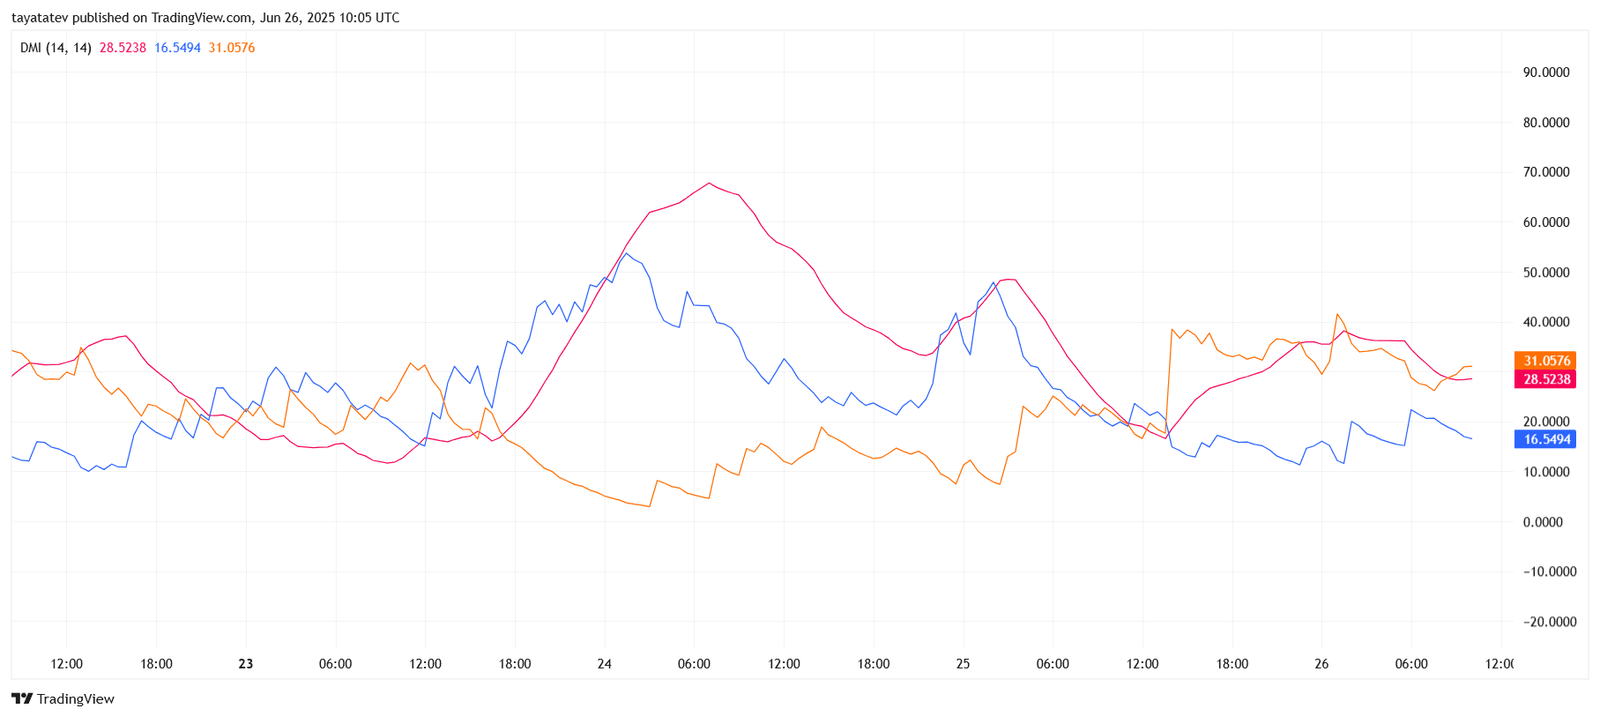
Meanwhile, the Directional Movement Index (DMI) for SEI/USDT reveals low conviction in either direction. The Average Directional Index (ADX), shown in orange, is at 31.05, slightly above the threshold of 25, which signals that a trend exists but lacks strong momentum. The +DI (Positive Directional Indicator), shown in red, is at 28.52, while the –DI (Negative Directional Indicator), shown in blue, is at 16.54.
SEI/USDT Directional Movement Index. Source: TradingView
The Directional Movement Index helps identify the presence and direction of a trend. The ADX measures trend strength, not direction. When ADX is below 25, the market is usually consolidating. When it rises above 25, it confirms that a trend is in place. The +DI line measures bullish pressure, and the –DI line measures bearish pressure. A crossover between these two lines helps determine who is in control.
In this chart, +DI is above –DI, suggesting buyers are gaining some control. However, the recent decline in ADX and the close positioning of the lines show that neither side has a decisive lead. The weakening ADX means the current trend is not strong, and volatility may remain low unless either DI line breaks sharply.
SEI/USDT Stochastic Momentum Index Signals Bearish Reversal
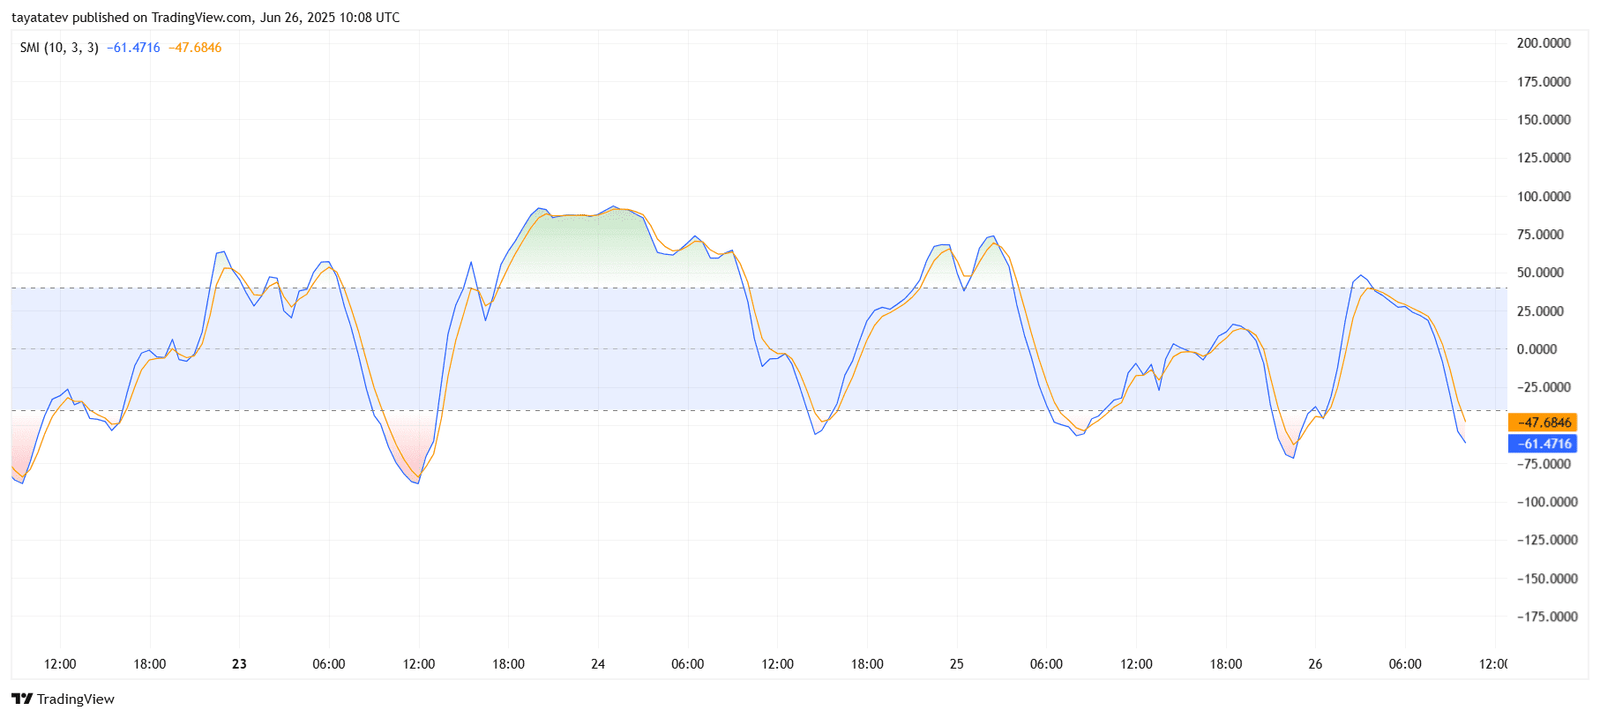
The Stochastic Momentum Index (SMI) for SEI/USDT shows values of –61.47 for the blue line and –47.68 for the orange signal line. The SMI is a refined version of the traditional stochastic oscillator, which tracks the position of the current close relative to the midpoint of a recent high-low range, providing clearer momentum signals.
In this chart, both the main line and signal line have dropped below the –40 level, signaling increasing bearish momentum. The blue line has crossed below the orange line while heading downward, which confirms a bearish crossover. This pattern usually suggests that sellers are gaining control and that price may continue to weaken in the short term.
The SMI operates in a range between –100 and +100. When values fall below –40, it indicates the asset is entering bearish territory. A recovery would require the blue line to reverse upward and cross back above the orange line, ideally above the –40 threshold.
Tatev Avetisyan is a Markets Writer and Analyst at CoinChapter, covering cryptocurrency markets, policy, and regulation. With over seven years of experience in business and marketing development, she has spent the past two years specializing in digital assets and has authored more than 2,000 articles on crypto markets and regulatory developments.She contributes as a guest writer to leading industry publications and is a prominent Web3 advocate in Armenia through Web3Armenia. Her work reflects a broader focus on artificial intelligence and Web3 technologies.
Tatev maintains a diversified crypto portfolio, with Bitcoin as her primary holding above CoinChapter’s $1,000 disclosure threshold.