
Shiba Inu (SHIB) advanced on Tuesday after becoming the first memecoin to be listed on Folks Finance, a leading cross-chain decentralized finance protocol. The listing allows SHIB holders to lend and borrow tokens across multiple blockchains.
Cross-Chain Lending for SHIB
SHIB’s official X account confirmed that the token is now supported on Folks Finance’s lending and borrowing platform. Users can deposit SHIB, earn yields, or use the coin as collateral in one unified liquidity pool across chains.

This functionality is powered by Chainlink’s Cross-Chain Interoperability Protocol (CCIP), which connects blockchain ecosystems by enabling secure transfer of tokens and messages. Folks Finance called SHIB “the first memecoin with cross-chain lending markets” and said deposit incentives are now live.
Chainlink’s Role in Shiba Inu Expansion
The collaboration highlights SHIB’s ongoing engagement with Chainlink technology. Last year, Shiba Inu ecosystem tokens, including SHIB, Doge Killer (LEASH), and Bone ShibaSwap (BONE), adopted the CCIP standard. This integration made them available across twelve different blockchains, reducing liquidity fragmentation.
The new listing on Folks Finance extends this interoperability, positioning SHIB alongside major digital assets in decentralized lending.
Despite the milestone, SHIB’s burn rate showed no significant jump. Data from the official tracker reported 71,685 SHIB removed from circulation in the last 24 hours, up 2.63%.
At the time of reporting, SHIB traded at $0.00001236, reflecting a 0.67% daily gain but still down 41% year-to-date. Meanwhile, Chainlink’s LINK token was trading at $23.39, up 0.61%.
Shiba Inu Charts Signal Breakout Potential from Falling Wedge
The chart of Shiba Inu (SHIB/USD) dated September 3, 2025, shows the formation of a falling wedge pattern on the 4-hour timeframe. A falling wedge is a bullish technical formation where price action narrows between two downward sloping trendlines, typically indicating weakening selling pressure and the possibility of a breakout to the upside. In this case, SHIB has been consolidating within the wedge since mid-August, and its recent positioning near the resistance line suggests the potential for a breakout.

The current price stands at $0.00001240, trading almost in line with the 50-period exponential moving average (EMA), which sits at $0.00001239. This alignment reflects a critical technical point where the asset may attempt to cross above the EMA, often seen as a momentum confirmation. Trading volumes have remained steady but subdued during the wedge’s narrowing phase, which is characteristic of such patterns, as market activity tends to compress before a decisive move. However, a noticeable spike in volume would be needed to validate any breakout attempt.
If the falling wedge confirms and SHIB breaks above the resistance, the measured move from the widest part of the wedge projects an upside target of around 20 percent from the current price. This would place SHIB near $0.00001501, which coincides with a marked resistance level from late July. The convergence of technical signals, including the EMA test, wedge completion, and the potential for a volume surge, strengthens the case for this target. Until confirmation arrives through both price action and volume expansion, SHIB remains in a consolidation stage, but the technical setup indicates bullish potential.
Shiba Inu RSI Analysis Points to Neutral but Strengthening Momentum
The Relative Strength Index (RSI) chart for Shiba Inu (SHIB/USDT), dated September 3, 2025, shows the indicator hovering around 53.70 on the 14-period setting. The RSI has been oscillating in a broad range between 30 and 70 since July, reflecting sideways consolidation rather than clear overbought or oversold extremes. At present, the indicator leans slightly bullish as it pushes above the midpoint level of 50, a threshold that often signals improving momentum in favor of buyers.

The yellow moving average plotted over the RSI line, currently near 48.82, sits below the main RSI reading. This crossover is important because when the RSI moves higher than its moving average, it suggests strengthening bullish pressure. In this case, the RSI’s break above the average highlights renewed demand, supporting the idea that SHIB may be preparing for an upside move.
Volume conditions remain steady, and the RSI’s behavior indicates that neither buyers nor sellers hold overwhelming dominance. However, the shift above 50 after a period of prolonged consolidation could align with the falling wedge breakout seen on the price chart. If momentum continues to rise, RSI has space to approach 65–70 before reaching overbought conditions. This window leaves room for price expansion while still remaining within a healthy technical range.
Shiba Inu MACD Signals Show Building Momentum Ahead of Key Breakout
The Moving Average Convergence Divergence (MACD) chart for Shiba Inu (SHIB/USDT), dated September 3, 2025, reveals early signs of strengthening momentum. The MACD line, plotted in blue, is approaching a crossover with the signal line in orange near the zero level, which often indicates a shift in market direction. When the MACD crosses above the signal line around the zero axis, it is generally read as a bullish signal, reflecting renewed buying interest.
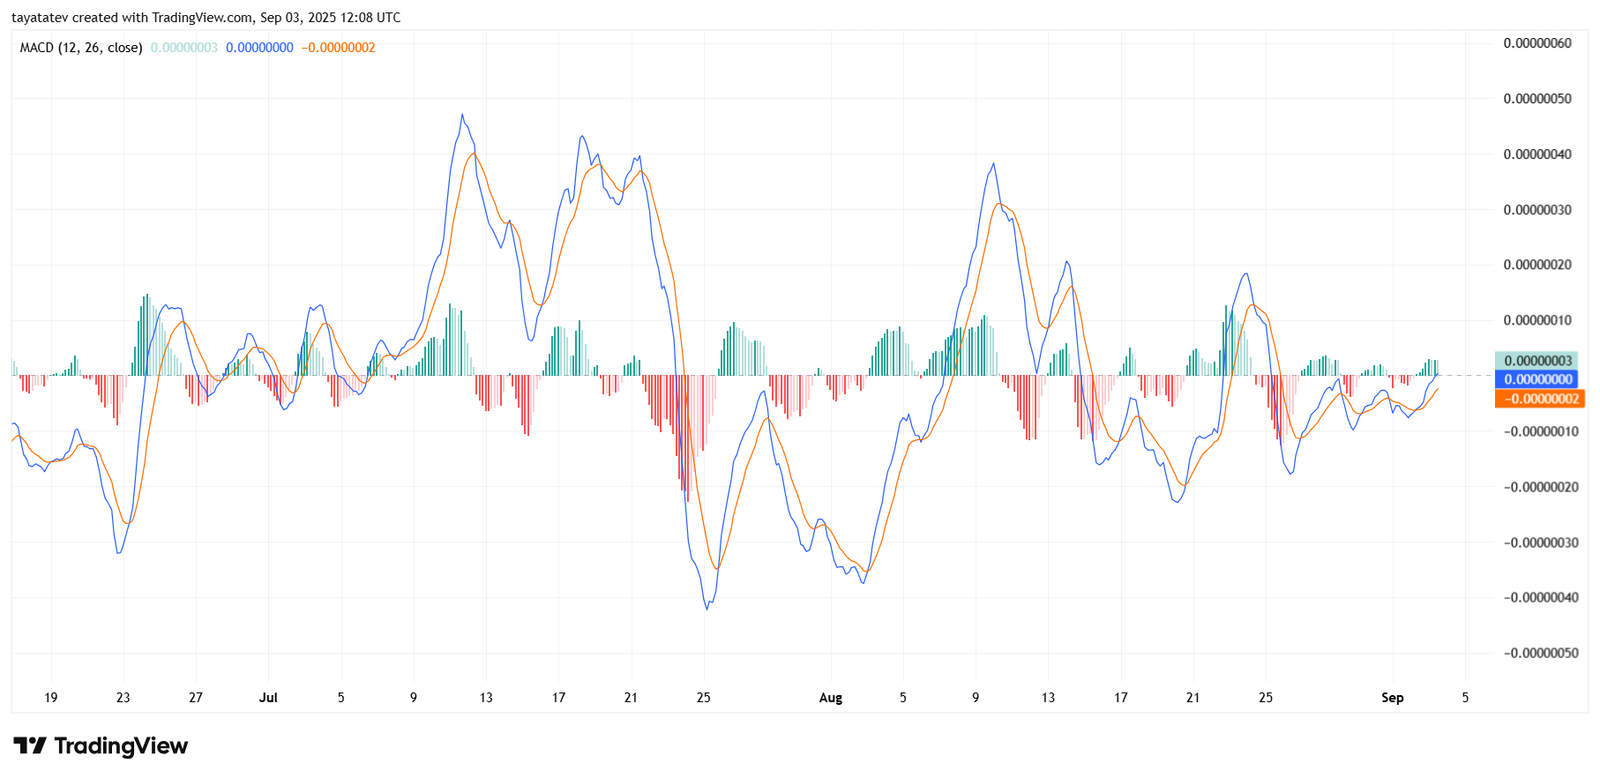
The histogram, which measures the difference between the MACD and signal line, has turned slightly positive after fluctuating between red and green bars over the past several weeks. This shift suggests that bearish pressure is fading and buyers are regaining control, though the move is still in its early stages. Sustained green bars on the histogram would confirm momentum is strengthening to the upside.
Looking back across July and August, the MACD displayed several sharp cycles where strong crossovers aligned with notable price surges and corrections. The current setup near equilibrium mirrors conditions often seen before decisive breakouts. With the MACD building upward momentum, the indicator supports the falling wedge breakout narrative on SHIB’s price chart. However, clear confirmation will depend on the MACD line closing above both the signal line and maintaining green histogram expansion over the next sessions.
