Shiba Inu (SHIB) has confirmed a bullish breakout from a falling wedge pattern on the 4-hour chart, with the price briefly touching $0.0000153 during the move. This wedge formation, observed between May 13 and May 21, had capped SHIB’s price action within a narrowing descending channel—a classic setup for a reversal.
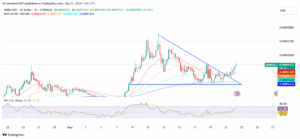
The breakout is reinforced by a notable surge in trading volume, which spiked to 138.09 billion SHIB during the breakout candle. This increase in participation lends technical validity to the breakout, a crucial factor when assessing wedge-based patterns. The price also closed above the 20-day and 50-day exponential moving averages, signaling a short-term shift in momentum toward the bulls.
RSI Builds Momentum but Approaches Critical Zone
Momentum indicators support the bullish structure, with the Relative Strength Index (RSI) currently reading 62.25. This level suggests that SHIB has room to climb before becoming overbought. However, the RSI is now approaching the 70 threshold, often seen as a warning for potential price exhaustion.
If RSI continues rising alongside price, it could indicate a healthy uptrend. However, if momentum fades while the RSI peaks, the rally may pause or retrace. For now, the indicator shows growing strength without signs of bearish divergence, keeping the breakout intact.
Bitcoin’s performance is playing a major role in SHIB’s price action. BTC is currently trading above $110,000 after a clean breakout of its own, with its RSI standing at 68.84 on the 4-hour chart. This places Bitcoin near overbought territory, but without showing signs of reversal, it suggests that the overall market remains in risk-on mode.
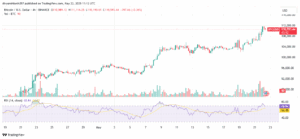
Historically, SHIB and other high-beta altcoins tend to follow Bitcoin’s direction, especially when BTC moves sharply. As long as Bitcoin maintains its momentum without a sharp correction, SHIB could benefit from rotational flows into altcoins, especially from traders seeking higher volatility opportunities.
SHIB Burn Rate Declines Despite Price Strength
While price and volume indicators suggest bullish momentum, SHIB’s tokenomics paint a more cautious picture. Data from Shibburn shows that just 13.57 million SHIB were burned in the last 24 hours. This is a decline of 11.53% compared to the previous period. Burn activity is one of SHIB’s primary deflationary mechanisms. When it slows during a rally, it can raise concerns about sustainability.
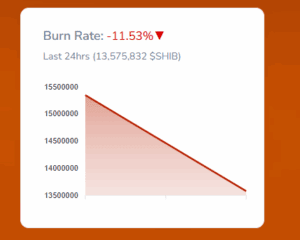
In recent months, Shiba Inu’s burn mechanism has been a key narrative among long-term holders. A declining burn rate amid rising prices could signal that the rally is driven more by short-term trading interest than by fundamental supply reductions. For SHIB to maintain a bullish macro structure, consistent or increasing burn volume would be ideal.
From a technical perspective, the $0.0000146–$0.0000141 range now acts as immediate support. These levels coincide with the 100-day and 200-day EMAs, which have historically served as reliable dynamic support zones. If SHIB remains above these moving averages, the bullish breakout structure remains valid.
The next key resistance lies at $0.0000165, a previous local top. A confirmed close above this level on higher timeframes could trigger a second leg upward toward $0.0000180. However, failure to break this resistance could result in a period of sideways consolidation or a short-term retracement back toward the wedge’s upper boundary.
