
According to Coinglass data, if Shiba Inu (SHIB) regains the 10% it recently lost, over $52 million in short positions could be liquidated. These liquidations would occur as short sellers are forced to buy back into the market, which could accelerate an upward price move.
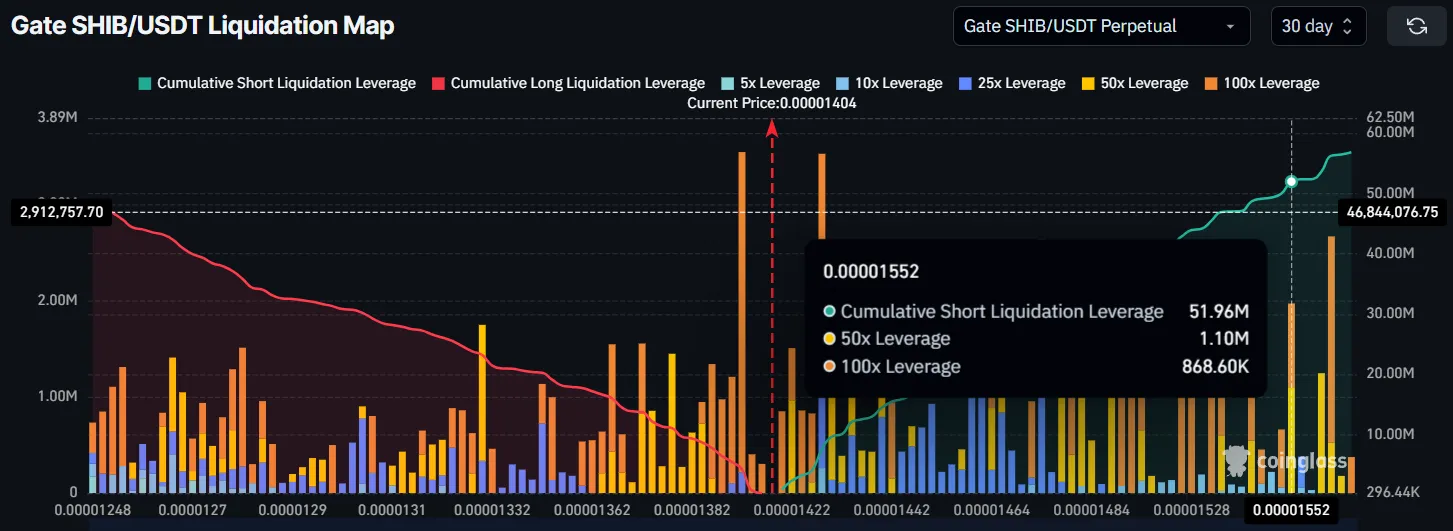
A short squeeze of this scale would likely trigger a spike in buying volume, potentially driving SHIB higher in the short term. The liquidation map shows concentrated short interest built around SHIB’s recent decline, setting the stage for a sharp reaction if the token rebounds.
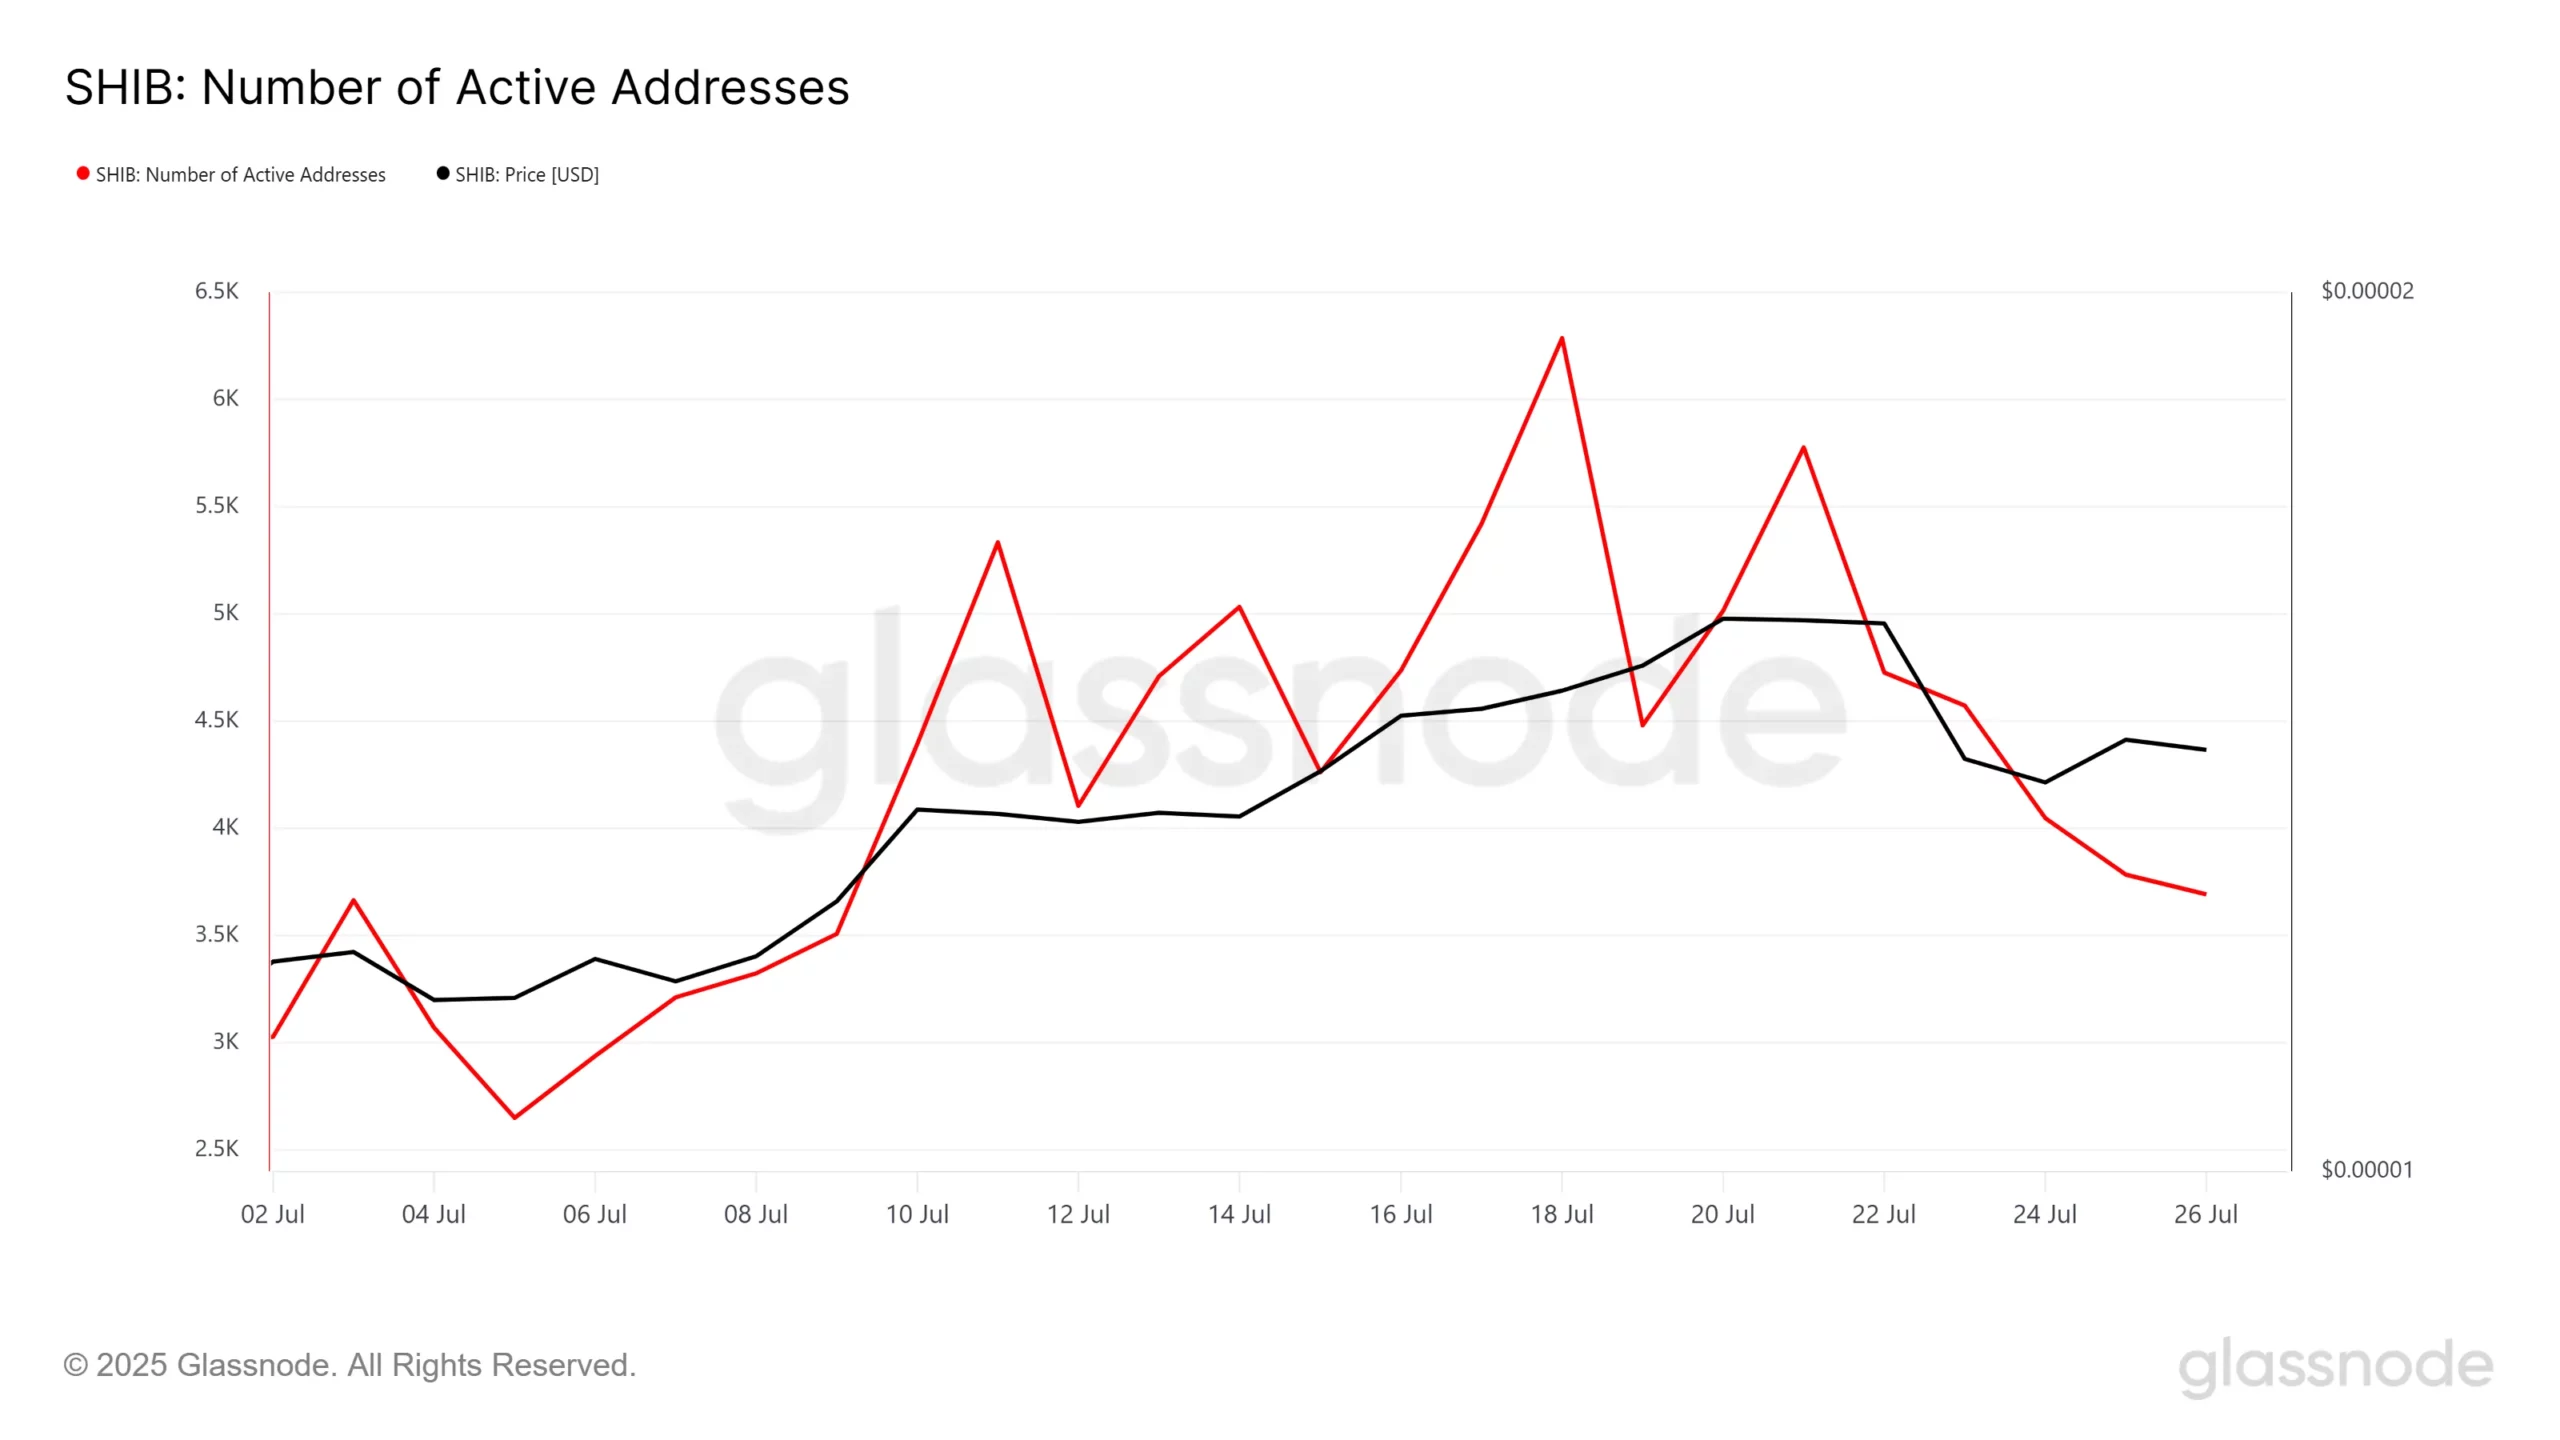
Shiba Inu Active Addresses. Source: Glassnode
Despite this setup, on-chain activity tells a more cautious story. Data from Glassnode shows that active SHIB addresses have dropped 36% in the past 48 hours. This decrease in user activity signals declining engagement and waning short-term confidence among holders.
Lower active address counts typically reflect weakening momentum and reduced transaction volume. As fewer participants interact with the network, the chance of sustained buying pressure decreases. This drop may limit the strength of any potential rebound—even if a short squeeze is triggered.
For now, SHIB’s short liquidation potential remains high, but the shrinking number of active users adds uncertainty to the outlook.
SHIBA INU Forms Rising Wedge Pattern, Signals Potential 16% Decline
On July 28, 2025, the SHIBA INU SHIB/ USDT 1-hour chart revealed a rising wedge pattern, formed between July 24 and July 28. This technical structure shows price climbing within two upward-sloping lines that are gradually converging. A rising wedge often suggests a weakening uptrend, where buying momentum slows even as price moves higher. It typically signals a possible bearish reversal.
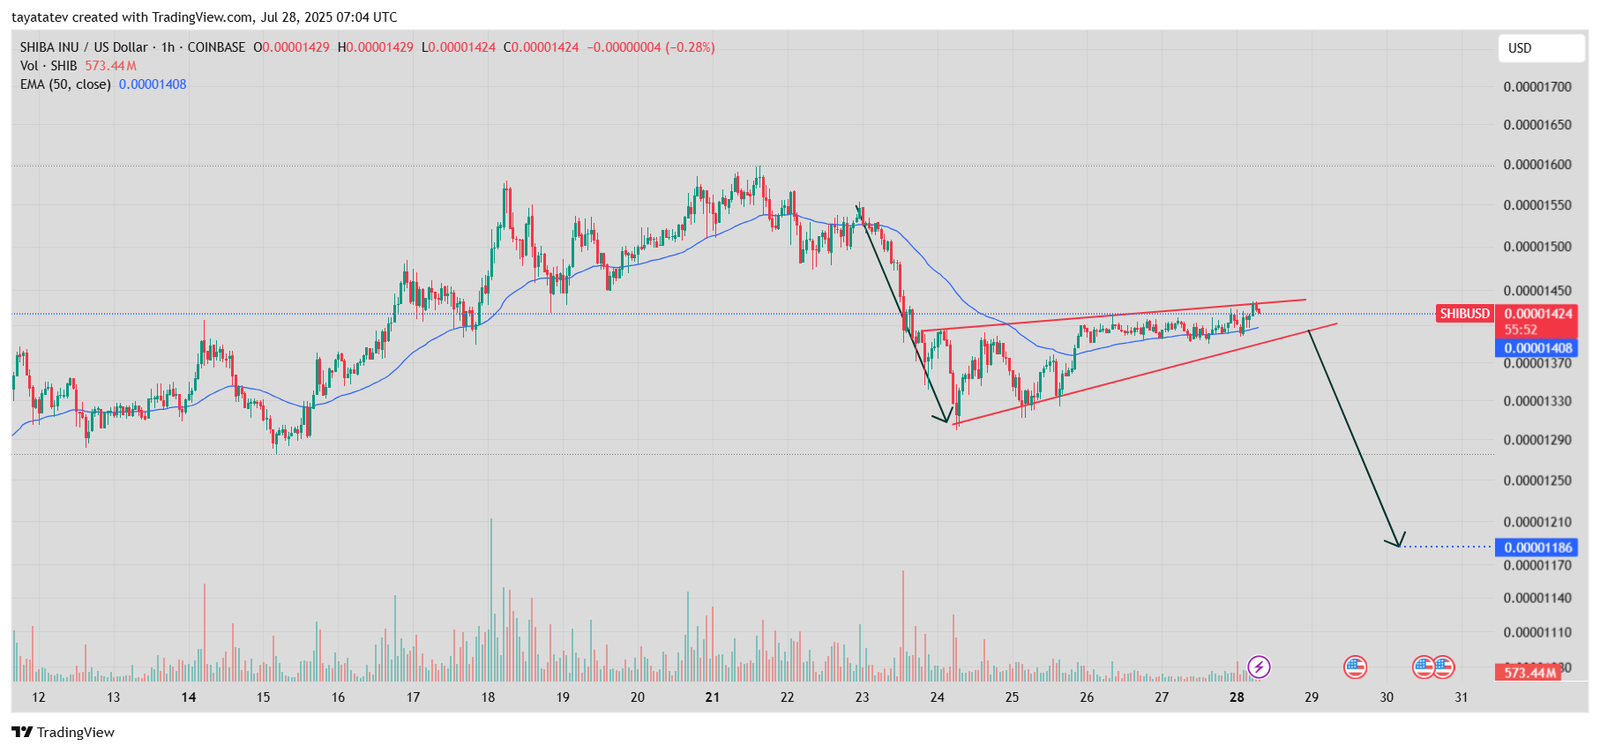
In this case, SHIB is trading around $0.00001424, sitting just above the 50-period Exponential Moving Average (EMA) at $0.00001408. The chart shows that the price has been moving sideways within narrowing boundaries, indicating pressure is building. Volume also remains relatively flat, which often precedes a breakout or breakdown.
The wedge is nearing its apex, and if the pattern breaks to the downside, the price could fall sharply. Based on the wedge’s height, the projected drop could reach approximately 16% from the current level. That move would push SHIB down to around $0.00001186, aligning with previous horizontal support levels marked on the chart.
The sharp arrow on the chart already suggests this potential scenario, pointing to a breakdown below both the EMA and lower trendline. If volume increases during a downward move, it may confirm a bearish breakout and add pressure on short-term holders.
For now, the rising wedge warns of a possible reversal. The price remains stable within the pattern, but the technical setup suggests SHIB could break lower toward the $0.00001186 mark if momentum shifts.
SHIBA INU RSI Stays Neutral, Shows Weak Momentum on July 28
The Relative Strength Index (RSI) chart for SHIBA INU (SHIB), created on July 28, 2025, shows the RSI value at 51.98 and the signal line at 55.34. The chart uses a 14-period setting on the 1-hour timeframe. This reading places SHIB in the neutral zone, far from both overbought and oversold conditions.
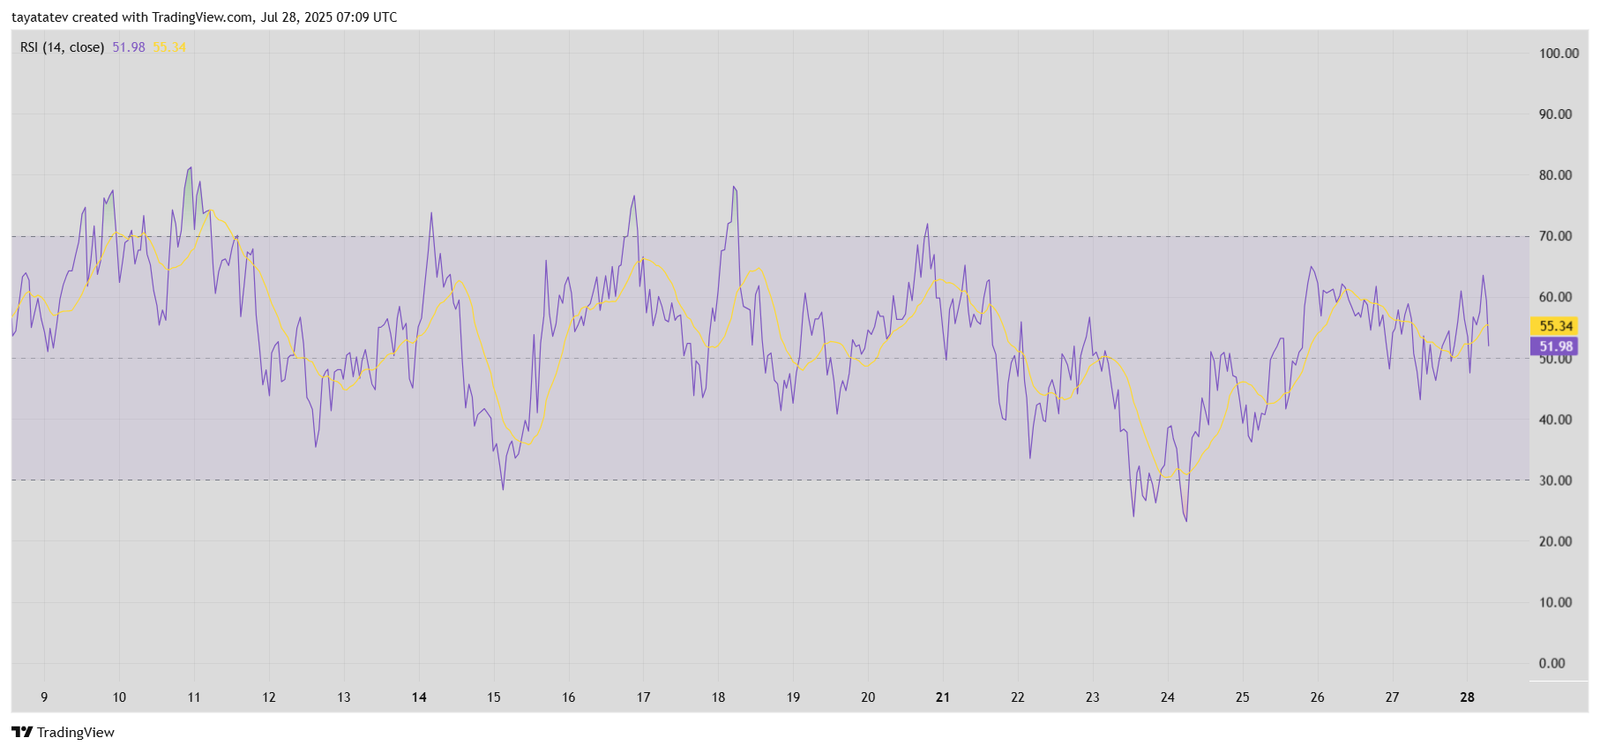
RSI is a momentum oscillator that measures the speed and strength of recent price changes. When RSI moves above 70, it signals overbought conditions; below 30, it indicates oversold territory. In this case, SHIB’s RSI has hovered between 40 and 60 over the past few days, reflecting indecision and a lack of dominant buying or selling pressure.
Although the RSI crossed above the signal line on July 26 and briefly pushed above 60, it failed to sustain upward momentum. Now, the RSI has dipped slightly below the signal line again. This shift suggests that bullish momentum has weakened and sellers may start gaining control.
The overall trend remains sideways, which aligns with the rising wedge pattern visible on SHIB’s price chart. RSI offers no confirmation of a breakout yet. Instead, it supports the idea that SHIB is consolidating and could be preparing for a stronger move once external pressure, such as liquidations or volume shifts, builds.
At this point, RSI indicates mild volatility and a wait-and-see environment. The next directional move may depend on whether RSI can break above 60 or drop below 45 in the sessions ahead.
SHIBA INU MACD Chart Shows Weak Momentum Shift on July 28
On July 28, 2025, the Moving Average Convergence Divergence (MACD) chart for SHIBA INU (SHIB) on the 1-hour timeframe shows a minor bullish crossover. The MACD line, shown in blue, crossed above the signal line in orange, with values sitting at 0.00000005 and 0.00000004, respectively. This crossover occurred with very low amplitude, and the histogram has just shifted from red to faint green.
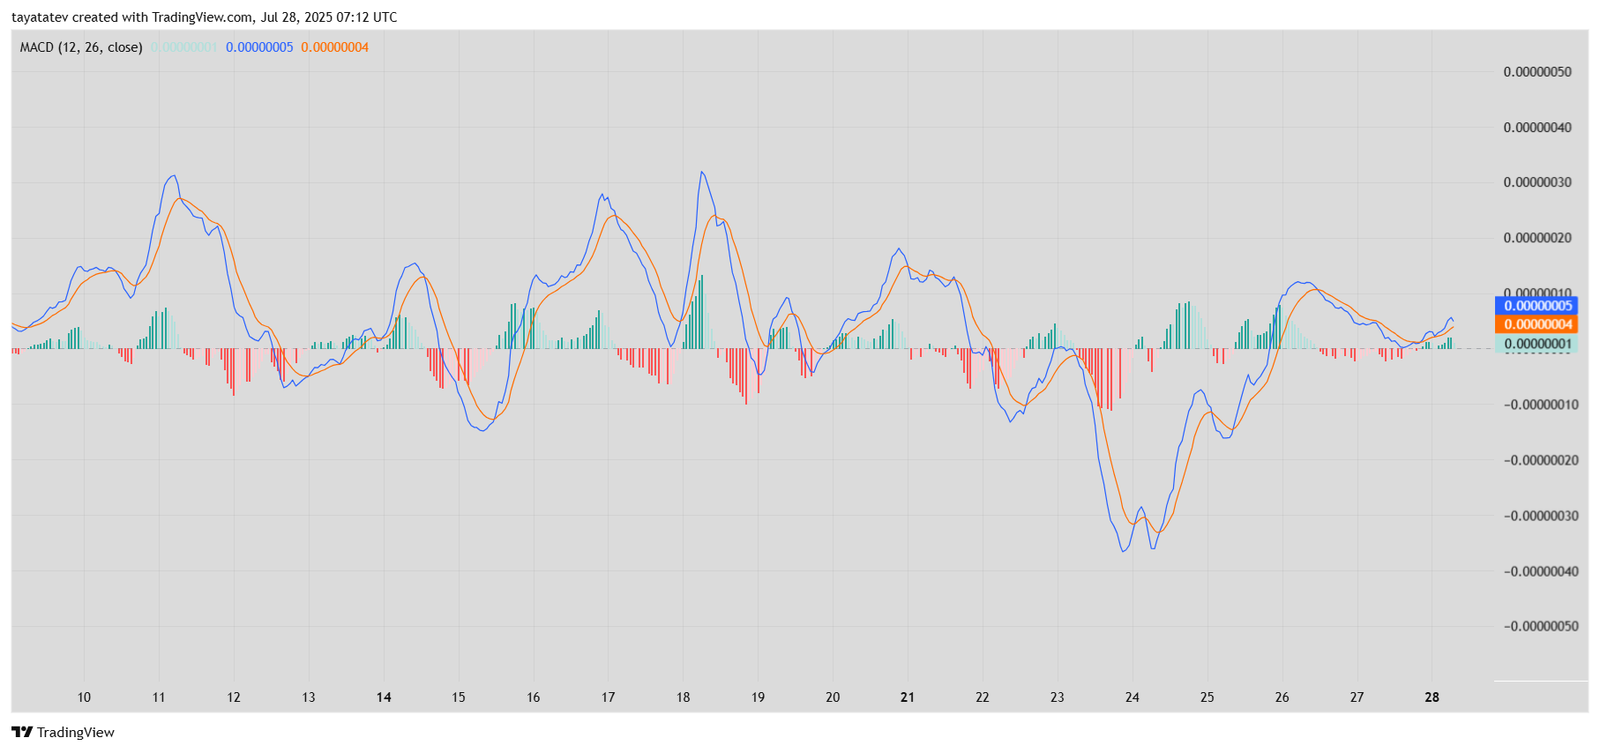
The MACD is a momentum indicator that reflects the relationship between two moving averages. A bullish crossover typically means short-term buying momentum is increasing. However, when this crossover happens near the zero line and with a flat histogram, it often signals weak momentum or indecision in the market.
In SHIB’s case, the histogram bars remain small, and both MACD lines are flat near the neutral line. This setup indicates that while buyers are slightly stronger at the moment, the overall strength is not convincing. The last few sessions show multiple failed rallies, where bullish momentum quickly faded after brief spikes.
This MACD signal aligns with the recent RSI reading, which also showed weak momentum. Together, these indicators suggest SHIB may continue consolidating until a stronger catalyst breaks the current pattern. For now, the MACD shows early signs of buying activity, but without volume support or a breakout, the move remains fragile.
