
SHIBA INU (SHIB) has formed a falling wedge pattern, visible on the 4-hour chart dated May 20, 2025. The formation begins at the May 11 high, showing two downward-sloping, converging trendlines that outline the wedge structure. The price continues to compress within this narrowing range.

A falling wedge is a technical pattern that typically indicates weakening selling momentum. Prices make lower highs and lower lows, but with diminishing force. If SHIB breaks above the upper trendline resistance, it could mark a shift away from bearish pressure.
As of the chart time, SHIB trades at $0.00001447, while the wedge resistance and the 50-period Exponential Moving Average (EMA) intersect near $0.00001476. This EMA level also acts as a dynamic resistance zone, tested multiple times since May 17.
If SHIB closes above the wedge resistance, the breakout projection based on the wedge’s height points to $0.00001993. This represents an approximate 39% increase from the current price.
Volume stands at 35.62 billion SHIB, and it has shown declining behavior during the wedge formation—typical of this setup. A spike in volume upon breakout would be critical to validate the move.
The RSI (Relative Strength Index), set at 14 periods, currently reads 47.15. It recently crossed above the 46.56 midline, suggesting a modest shift away from selling pressure. However, the RSI remains below the neutral 50 level, which signals cautious momentum.
Until SHIB confirms a breakout above the trendline and the EMA, the falling wedge remains intact. The pattern suggests a potential move, but confirmation depends on volume and RSI strength.
SHIB Whale Wallet Count Falls to 10,205, Extending Downtrend
At the same time, on-chain data from Santiment shows a consistent drop in the number of whale wallets. These are addresses holding at least 1 billion SHIB tokens. As of May 19, the total count stands at 10,205.
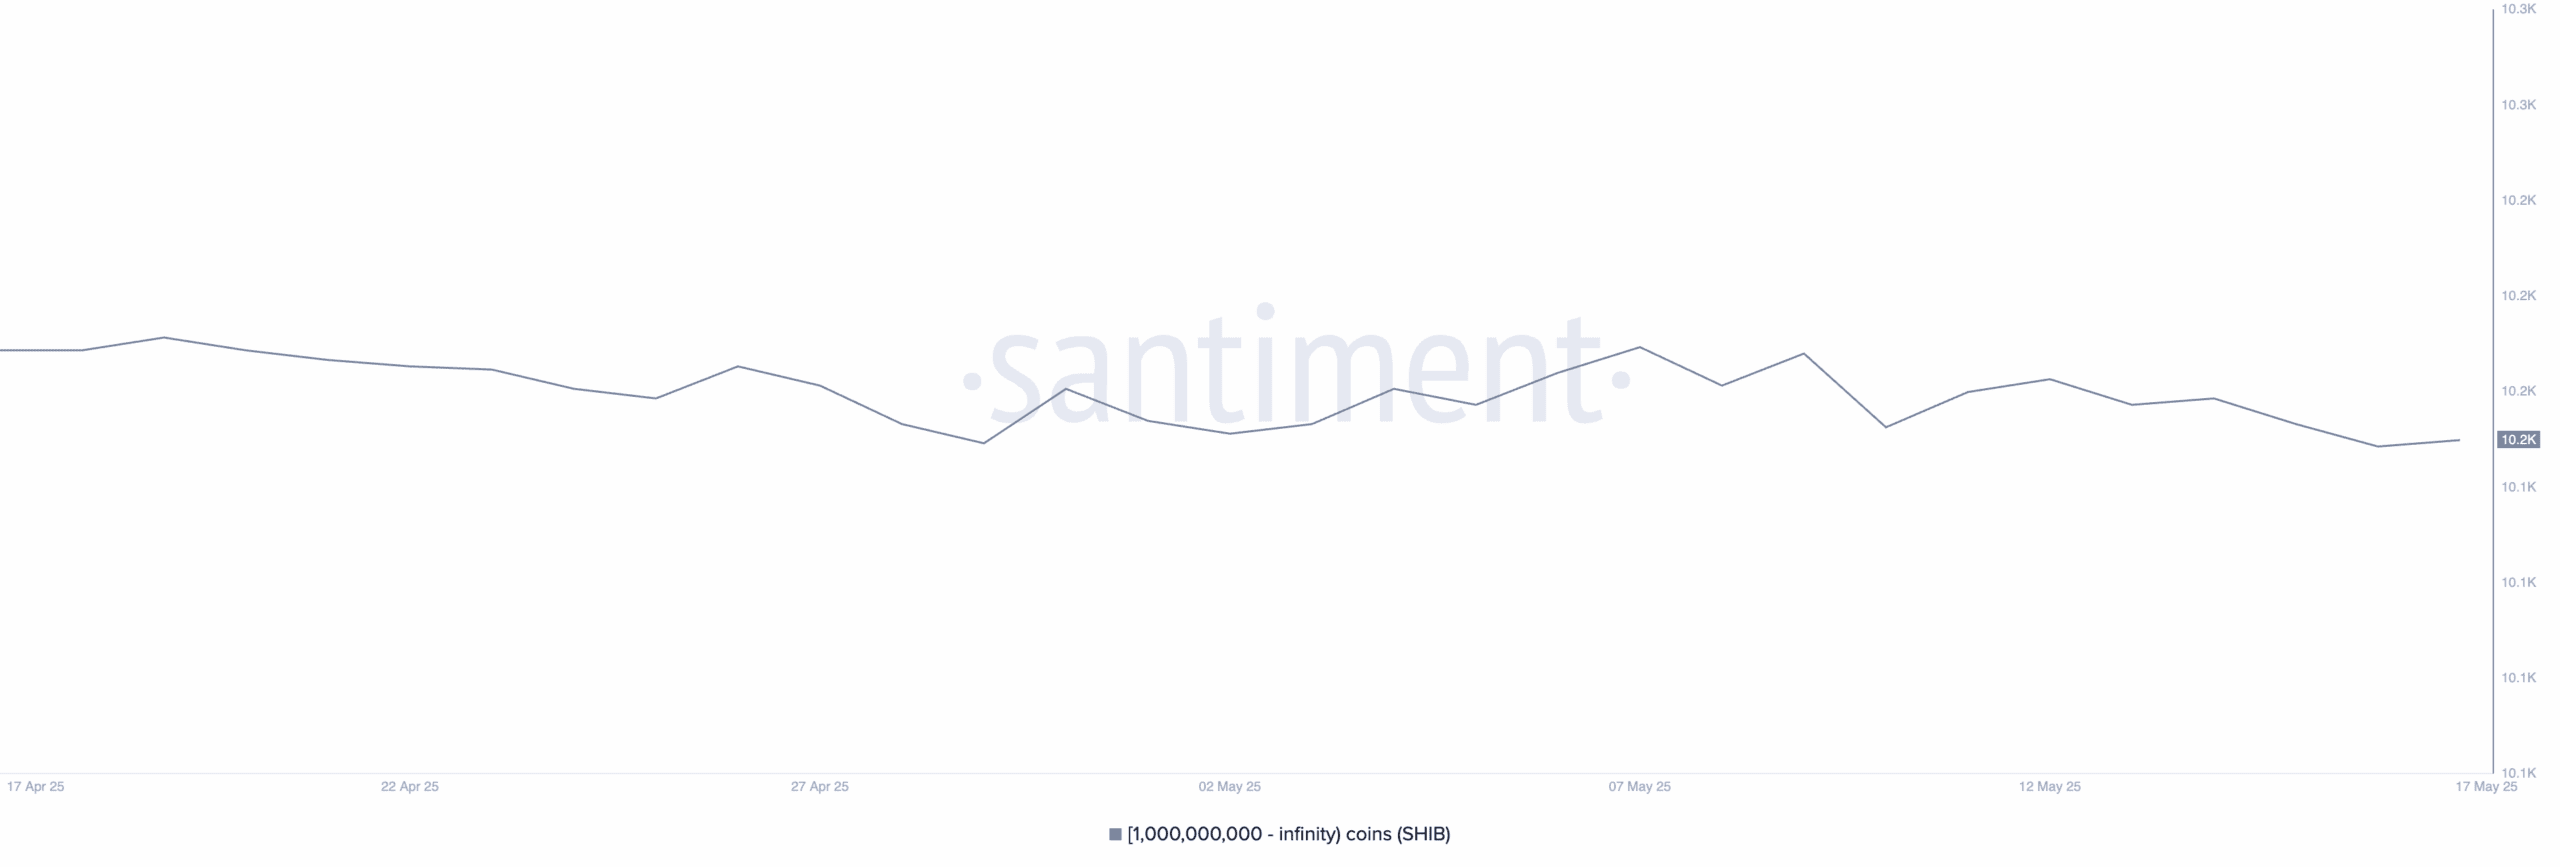
This is a decline from 10,232 wallets recorded nine days earlier. The reduction, while not dramatic, follows a longer-term pattern of declining large-holder activity. The number of SHIB whales has gradually fallen over recent months.
Santiment data suggests that whales significantly affect SHIB’s price direction. Large transfers from these wallets often signal trend shifts or broader sentiment changes. A lower count could mean a reduced capacity for high-impact moves.
The current whale wallet total is the lowest in the past two weeks. Despite brief increases, the broader trend has remained downward. This suggests some long-term holders are reducing exposure.
Santiment’s data dashboard shows no sudden movements in whale accumulations during the recent wedge formation. Instead, the data points to slow and steady trimming of large holdings. These shifts might not trigger immediate reactions, but they suggest possible risk-off behavior.
If the decline continues, SHIB’s liquidity from large holders may shrink. That could limit short-term surges unless new buyers enter.
Over 25 Trillion SHIB Held Near Current Price as Resistance Zone Tightens
According to IntoTheBlock’s Global In/Out of the Money chart, SHIBA INU (SHIB) faces a dense resistance zone between $0.000014 and $0.000015. At this range—just above SHIB’s current price of $0.00001447—a total of 25.74 trillion SHIB tokens are held by 34,170 unique addresses.

This cluster of holders reflects a critical price area where many participants entered the market. The size of the red volume bubble in this band highlights the potential difficulty SHIB may face in breaking through this resistance range. If the price moves into this zone, some holders may choose to exit at breakeven, adding selling pressure.
The visual data shows a significant imbalance between addresses “In the Money” (green) and those “Out of the Money” (red). The largest red bubble sits precisely within the $0.000015 to $0.000019 range, suggesting a wider zone of resistance if SHIB rises beyond the immediate level.
This concentrated holding range directly above the current market price could impact short-term momentum. Unless volume or new inflows push the price firmly through this wall of resistance, SHIB may remain capped by these clustered addresses.
34,170 Addresses Hold SHIB Near Break-Even as Price Hovers at Key Range
On-chain data shows that 25.74 trillion SHIB tokens are currently held by 34,170 addresses in the tight price range between $0.000014 and $0.000015. This range aligns with SHIB’s current price action, as the token hovers near $0.00001447, creating a potential decision point for a large segment of holders.
The IntoTheBlock chart highlights this band as a dense resistance area, where most addresses are either near break-even or holding at a slight loss. This setup often leads to indecision. Some holders may exit at cost if upward movement stalls, while others may wait for a stronger rebound.
