NOIDA (CoinChapter.com) — Shiba Inu (SHIB) price has painted back-to-back green daily candles, sparking fresh enthusiasm among holders after briefly reclaiming the $0.000013 zone. The memecoin’s minor upward momentum aligns with broader optimism across the altcoin market, with Bitcoin holding above $97,000 and Ethereum clinging to the $1,800 handle.
As usual, speculative sentiment trails closely behind SHIB’s price movement. Bullish calls flood social media, with the so-called “SHIB Army” promoting a scenario where the token “sheds a zero” and climbs toward $0.00013—a nearly 10x jump from current levels.
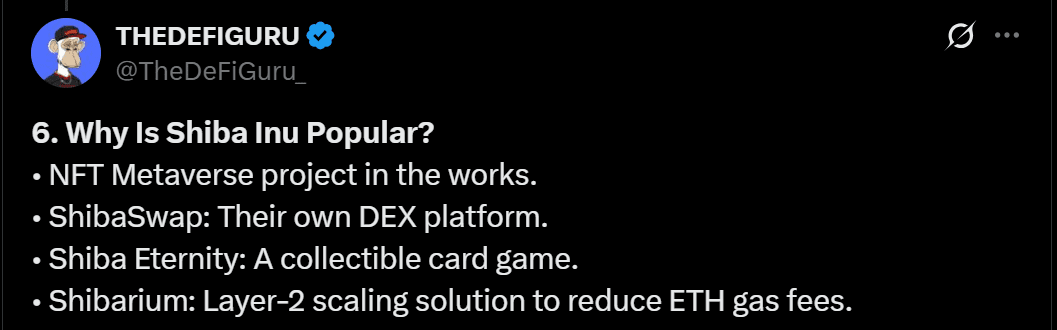
Supporters cite ongoing ecosystem developments such as the Shibarium Layer-2 blockchain, the ShibaSwap DEX, and DAO governance as key fundamentals behind the rally narrative. The most celebrated catalyst remains the project’s aggressive token-burning mechanism, which the community claims will create long-term scarcity and upward price pressure. But the math behind this narrative tells a different story.
Burning a billion tokens per day—a generous assumption—would take nearly 1,500 years to remove 90% of SHIB’s circulating supply. Even the largest recent burns barely scratch the surface of the 589 trillion supply. Meanwhile, Shibarium adoption has remained modest, ShibaSwap continues to lag behind market leaders, and community governance has yet to produce a single impactful proposal. Other initiatives like the Shiba Eternity game or metaverse integration generate excitement but lack measurable traction.
While SHIB’s bullish crowd doubles down, a deeper look at price structure reveals warning signs that could undercut the euphoria.
Bearish Pattern Threatens Memecoin With Deep Price Slump
Shiba Inu’s recent uptick comes under pressure as its broader market structure reveals a descending triangle—a bearish continuation pattern often appearing during extended downtrends. A flat horizontal support line and a downward-sloping resistance trendline, highlighting persistent lower highs, characterize the triangle pattern. This setup signals weakening buying pressure as each bounce fails to match the previous one, increasing the likelihood of a breakdown.
SHIB’s price action fits this definition closely. Since late February 2025, the memecoin has posted successive lower highs, while buyers have defended the same horizontal support area near $0.000012. The lack of upward momentum suggests an exhaustion of bullish sentiment.
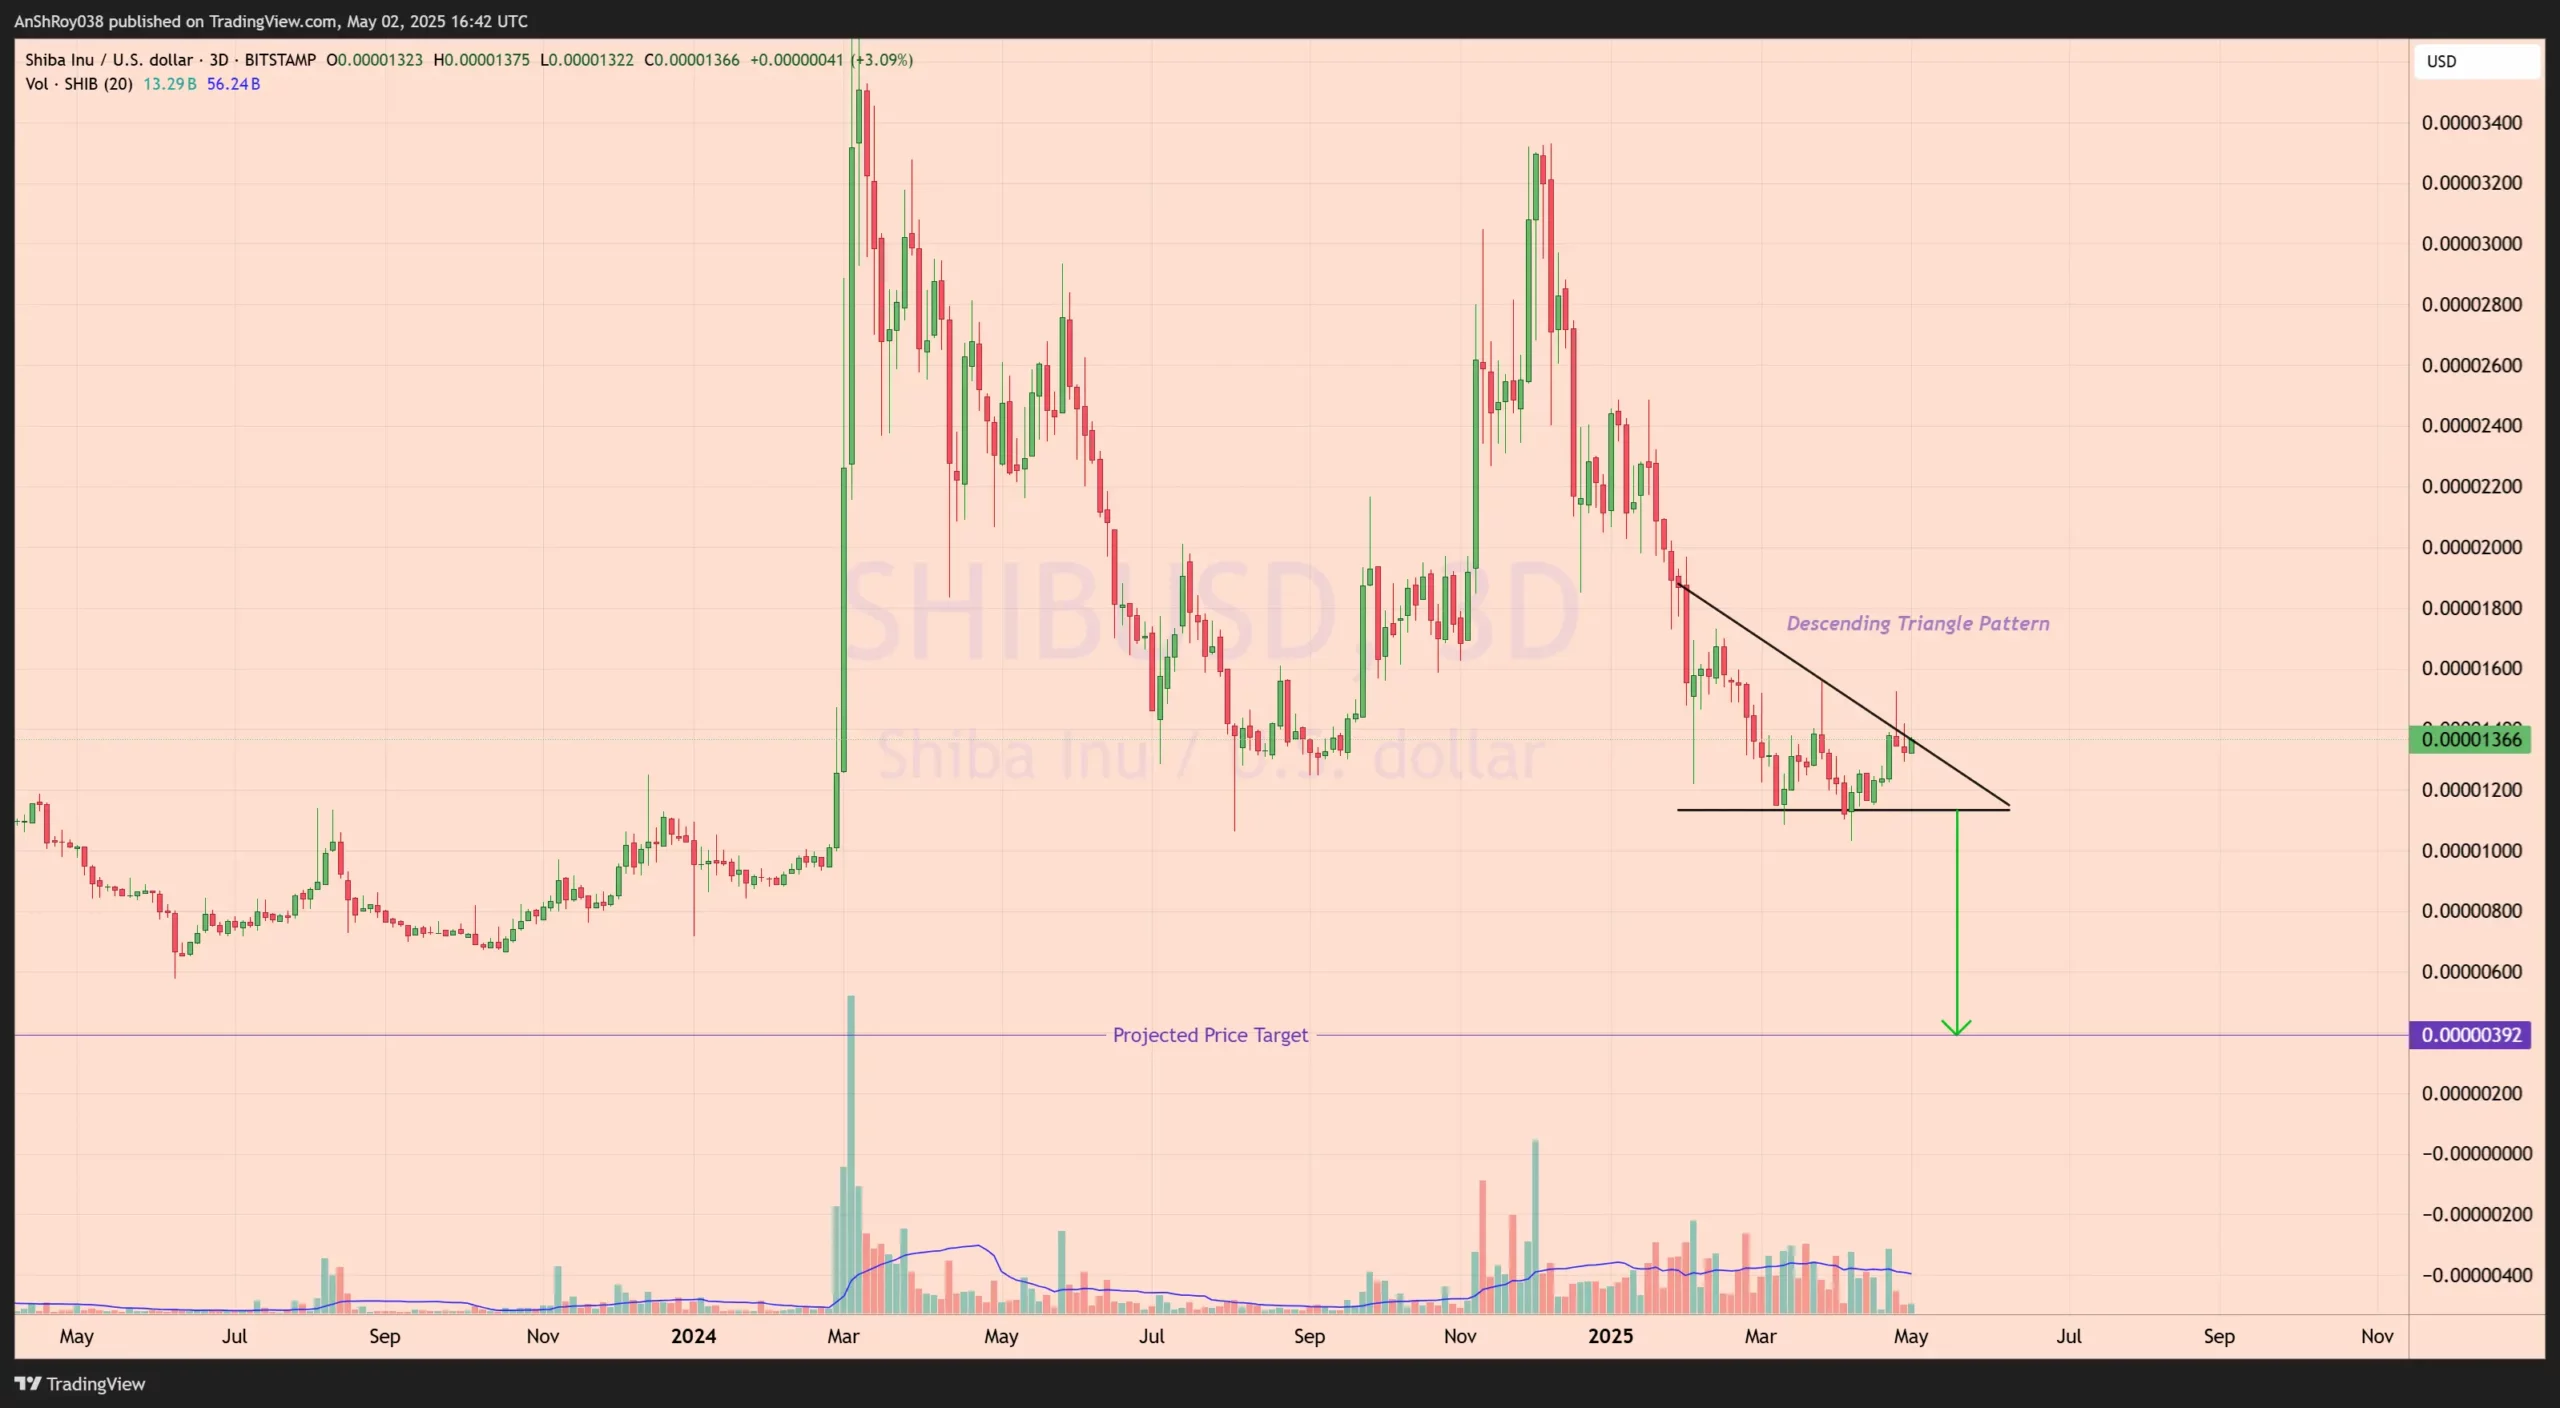
Despite back-to-back green candles, the token remains capped under the triangle’s declining resistance line, failing to register a breakout.
Technically, traders derive the price target by measuring the vertical distance from the initial high point of the triangle down to the horizontal base. That height is then subtracted from the eventual breakdown point to estimate a potential downside objective. This method reflects the full extent of bearish pressure if the pattern plays out as expected.
Currently, SHIB hovers dangerously close to the breakdown zone. If sellers push the price below the support floor, the pattern activates, potentially triggering a steep sell-off. Unless bulls invalidate the triangle with a high-volume breakout above resistance, the structure favors further downside.
As such, SHIB price could drop to $0.0000039, a potential loss of over 71% from current levels.
SHIB Rally Faces Exhaustion As Key Resistance Levels Hold Firm
SHIB price’s recent recovery rally has started to show signs of fatigue, with the token flashing signals of a potential consolidation phase. After rebounding from the $0.00001 zone on April 9, SHIB climbed toward the $0.0000136 level but now struggles to break decisively above the 100-day EMA (blue) resistance near $0.0000146.
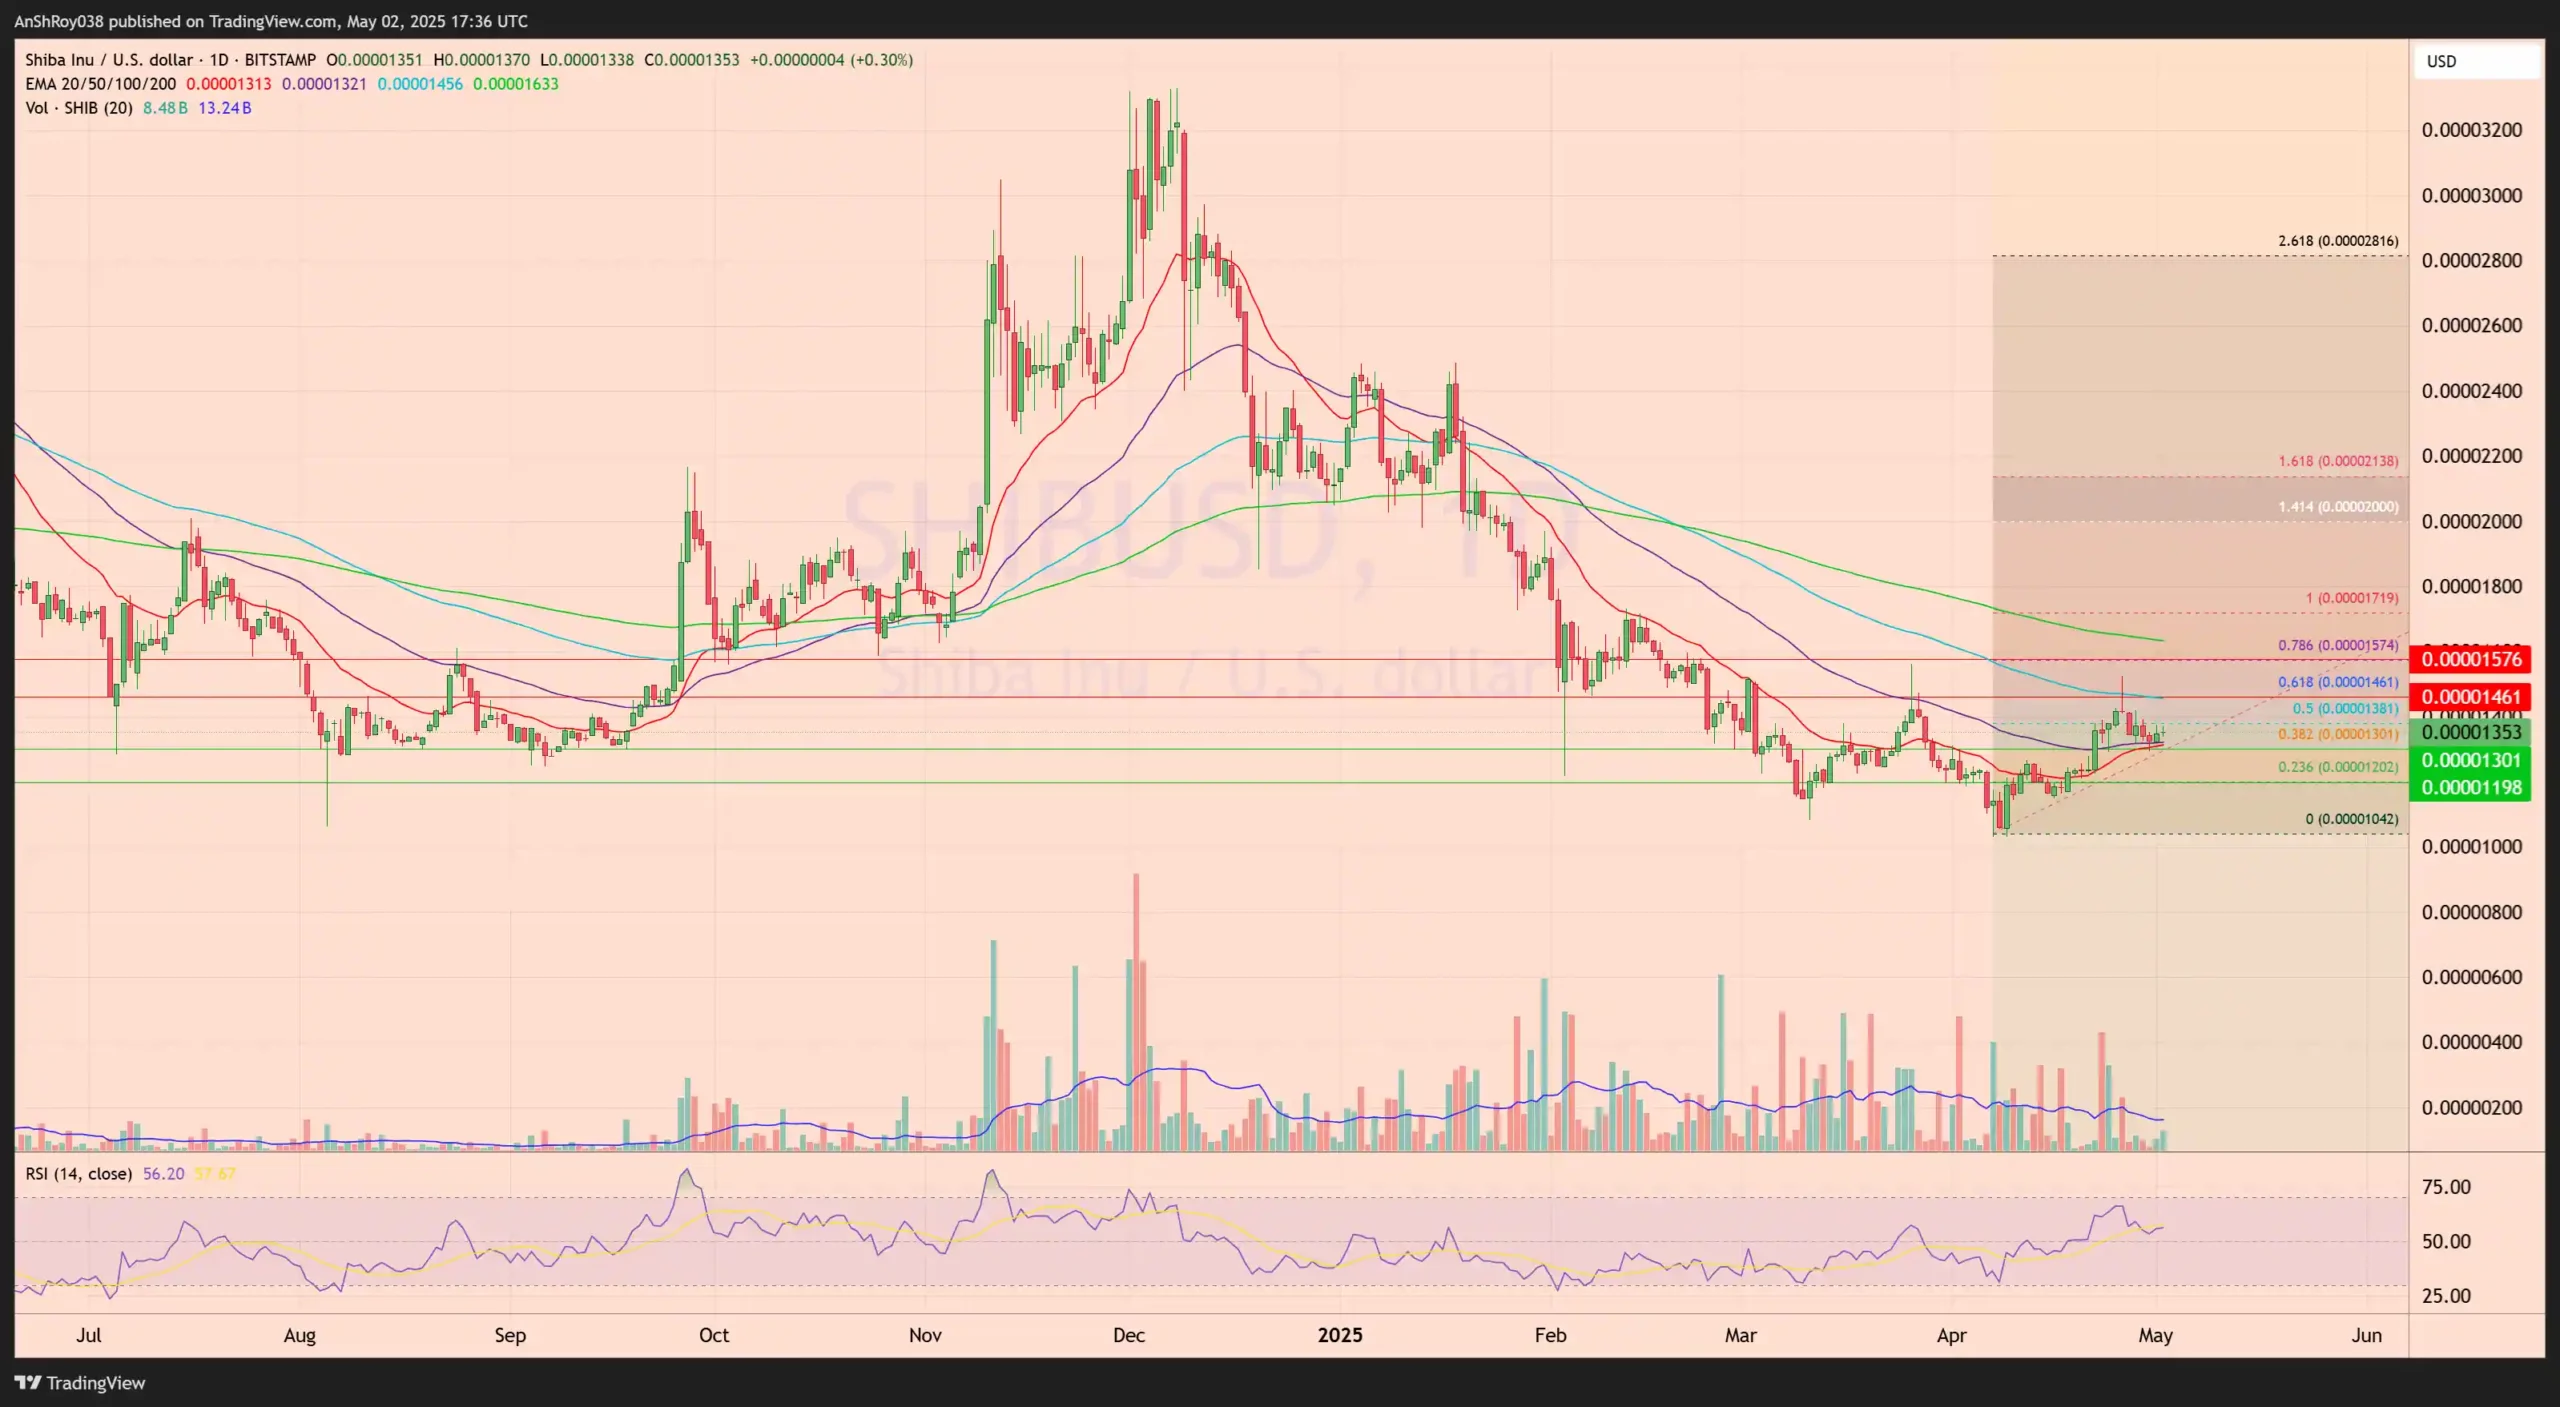
The price currently trades between converging exponential moving averages. The 20-day EMA acts as immediate dynamic support near $0.0000130, while the 100-day EMA looms overhead at $0.0000146. This EMA cluster forms a compression zone, indicating reduced momentum and possible indecision among traders.
A clean breakout above the 0.618 Fib level would expose resistance at $0.0000157, near the 0.786 Fib retracement. However, failure to flip this zone into support would likely trap SHIB in a tightening range.
On the downside, support rests at $0.0000130 and $0.0000120, corresponding with the 0.382 and 0.236 Fib levels. A drop below both levels could drag the Shiba Inu token price back toward the $0.0000119 accumulation base. Volume has declined steadily since the April bounce, while RSI hovers near 56, failing to generate new momentum.
Unless bulls reclaim higher ground soon, SHIB risks entering a multi-week consolidation phase, defined by waning momentum and tightening price structure.
