
Recent on-chain data shows that large investors may be quietly accumulating Shiba Inu (SHIB). One of the strongest signals is the -34.1 trillion SHIB netflow from exchanges. A negative exchange netflow means investors are moving off their tokens from exchanges to their private wallets. This is typically a sign of long-term holding behavior and often seen before price rallies, as fewer tokens are left on exchanges for immediate sale.
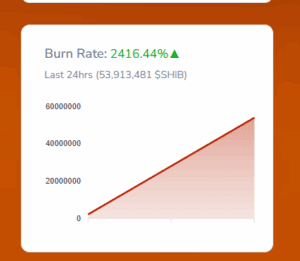
Burn Rate Skyrockets 2400% in 24 Hours
Adding to the bullish on-chain setup is the rise in token burning activity. Shiba Inu’s burn rate surged by 2,416.44% in the past 24 hours, with over 53 million SHIB tokens burned. Burning removes tokens from circulation permanently, reducing supply over time. While the total supply of SHIB remains very large (over 999 trillion), sharp daily burns like this contribute to deflationary pressure—especially when paired with whale accumulation.
Additionally, active addresses and transaction counts have remained mostly stable in recent weeks. This suggests that while the general retail interest hasn’t surged, the core user base is consistent, supporting the idea of silent accumulation rather than hype-driven buying.
The number of active addresses has hovered around 10,000 to 15,000, with occasional spikes above 20,000. Transaction volume, though not at all-time highs, also remains steady—indicating ongoing user interaction with the SHIB ecosystem.
Open interest in SHIB futures has been climbing, rising to above $100 million, according to Coinglass data. This shows more money is being deployed in SHIB derivatives. When combined with mostly positive funding rates, it suggests traders are leaning slightly bullish in the short term.
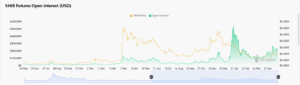
Funding rates measure the cost of holding long or short positions in perpetual futures. Recent rates have stayed in positive territory, which often points to more longs than shorts, another indirect signal of bullish sentiment.
Technical Indicators Show SHIB Coiling in Tight Range Near Key Support
Technical indicators support the idea of accumulation. As of May 26, SHIB trades at $0.00001453, with a small 1.36% dip on the day. The price has formed a consolidation range between $0.00001400 and $0.00001550, after previously rejecting resistance around $0.00001700 earlier this month.
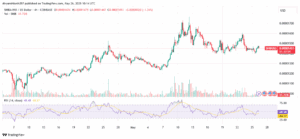
The Relative Strength Index (RSI) is currently neutral at 48.48, indicating no immediate overbought or oversold conditions. Meanwhile, the price structure is showing higher lows since the May 24 bottom, suggesting mild bullish divergence and potential for upward movement.
Key support levels to monitor include $0.00001400 and $0.00001320, while resistance lies at $0.00001550 and $0.00001700. If SHIB breaks above $0.00001550 on strong volume, the next targets are $0.00001650 and $0.00001720. However, if the token falls below $0.00001400, it could revisit $0.00001320 support.
