Shiba Inu (SHIB) may be forming a bullish reversal structure on the charts, according to a recent analysis shared by InvestingHaven. The analyst believes a breakout could drive SHIB to $0.0000666, nearly five times higher than its current price of $0.000011.
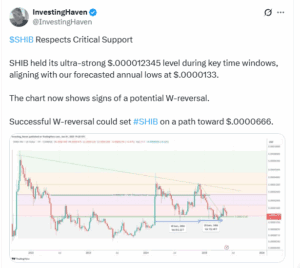
The analysis points to a possible “W-reversal” — a chart pattern that often signals a market bottom followed by a trend reversal. This pattern has formed near the $0.000012345 support zone, which SHIB has tested several times since January. The same zone also aligns with the analyst’s projected annual low of $0.0000133.
SHIB’s price is currently hovering around $0.00001168, holding just above a structural support zone between $0.00001150 and $0.0000133. This base level was established after a resistance-support flip earlier this year and has since acted as a buffer during repeated sell-offs. The daily chart still shows SHIB trading below all major EMAs—20, 50, 100, and 200-day—suggesting that the trend remains downward for now.

However, there are early signs of a pickup in short-term interest. As of June 17, SHIB’s 24-hour trading volume rose over 43%, reaching $158.5 million, with nearly all of it taking place on centralized exchanges. Higher volume near strong support levels can indicate growing short-term interest from traders, though sustained accumulation has not yet been confirmed.
On-Chain Data Challenges Analyst’s Bullish Outlook
Despite technical support and rising volume, SHIB’s on-chain data suggests limited network engagement. Shiba Inu network growth has dropped by 77% since January. On May 18, just 1,093 new addresses were recorded, compared to nearly 4,900 at the beginning of the year.

Wallet distribution data shows a clear shift in ownership. Between March and May, wallets holding between 100 million and 1 billion SHIB dropped from 73.6K to 71.9K, a decline of approximately 2.3%. These wallets are typically associated with larger investors, and the decrease suggests that whales are scaling back their exposure.

At the same time, wallets holding between 10,000 and 100,000 SHIB continue to grow. This trend indicates that retail traders are entering while larger holders exit. This is a common pattern during distribution phases, not bullish accumulation cycles.
Exchange Flows and SHIB Burn Rate Show No Support for Reversal Yet
CryptoQuant data shows SHIB saw net outflows of 24 trillion tokens on June 16. This suggests that traders are moving funds away from exchanges, but without a corresponding rise in network usage or accumulation elsewhere.
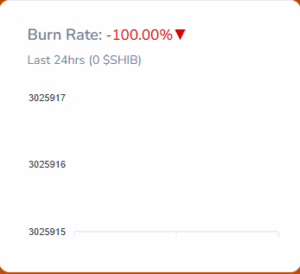
The SHIB burn mechanism, which permanently removes tokens from circulation to reduce supply, has stalled. According to data from Shibburn, no tokens were burned in the last 24 hours, and the burn rate dropped by 100%. This eliminates one of SHIB’s most promoted deflationary drivers, at least in the short term.