
A recent chart analysis by trader Javon Marks suggests that Shiba Inu (SHIB) may be forming an Inverse Head & Shoulders (IH&S) pattern. The pattern, which traditionally indicates a potential trend reversal, includes a price target of $0.000081. This level would represent a gain of approximately 503% from the token’s current market value of $0.00001274.
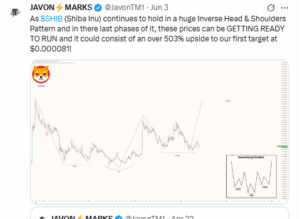
However, pattern-based projections remain unconfirmed without corresponding breakout volume and follow-through price action. SHIB has yet to surpass neckline resistance around $0.000014, which would be required for the pattern to validate.
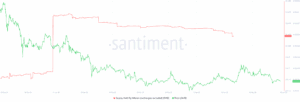
Shiba Inu Whale Holdings Drop by 2.8% Over Two Months
While the analyst points to a possible bullish reversal, on-chain data shows weaker support for that move. Santiment data indicates a reduction in SHIB supply held by large wallets (excluding exchanges). Between April and early June, this category of holders reduced their combined balance from 751 trillion to 730 trillion SHIB, a decline of nearly 2.8%.
This trend also coincides with SHIB’s broader downtrend. The token has dropped 11.42% over the past 7 days, trading at $0.00001274 with a market cap of $7.51 billion. 24-hour trading volume stands at $141.6 million. Other top meme coins also show weakness: Dogecoin, for instance, is down 16.04% over the same period.
Beyond price and holdings, ecosystem usage data also reflects declining engagement. Data from DeFiLlama shows that Shibarium, Shiba Inu’s layer-2 blockchain, has seen its Total Value Locked (TVL) fall to $2.33 million. This marks a retracement from the protocol’s peak of around $7 million earlier in 2025.
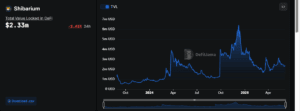
The decline in TVL shows a reduction in user engagement and capital inflow into SHIB’s ecosystem. It also limits potential catalysts that could support upward momentum from the IH&S pattern. Without ecosystem activity to reinforce bullish sentiment, technical patterns alone may prove insufficient.
RSI Hovers Near Oversold – Support Zone Holds for Now
On the 4-hour chart, SHIB is currently below a descending trendline resistance extending from the mid-May high of $0.00001604. Current price action hovers around the 0.236 Fibonacci retracement level at $0.00001277, just above the key demand zone between $0.0000122 and $0.0000125.
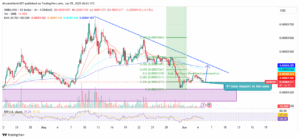
If this support zone holds, Shiba Inu coin price could rebound toward immediate resistance levels at $0.00001329, $0.00001368, and $0.00001385, which align with the 50, 100, and 200 EMA lines. A clean breakout above the neckline at $0.00001407 would mark the earliest signal for bullish continuation.
Moreover, the Relative Strength Index (RSI) is currently between 39 and 47, showing mildly oversold conditions with no strong divergence. Volume has also decreased steadily, signaling hesitation among both buyers and sellers.
