
Shiba Inu (SHIB) has broken out of a long-term trendline that had been holding the price down since late 2024. A TradingView analyst believes this move could lead to a wider price rally and has projected a path toward $0.000033 if the current structure remains in place.
Analyst Calls the SHIB Breakout a Major Reversal
The analyst pointed out that SHIB had been trading within a falling wedge since December 2024. This is a technical pattern that usually appears at the end of a long downtrend and often leads to an upward reversal. According to the chart, SHIB moved above the top of the wedge in mid-July 2025. The breakout happened with rising volume, and the price has stayed above the trendline since then.

As of July 25, SHIB to USD is trading near $0.00001364 and is holding the breakout level. TradingView’s analyst expects this breakout to remain valid as long as the price stays above the support zone drawn from Fibonacci retracement levels.
The analyst marked the price range between $0.000013011 and $0.000012314 as a key support area. This zone comes from the 50% and 61.8% Fibonacci retracement levels — often called the “golden pocket.” In many cases, prices that break out from a pattern pull back to this zone before continuing higher.
SHIB pulled back to this area after the breakout and bounced, which supports the view that buyers are still active. If the price falls below $0.00001200, the analyst maintains that the bullish case would no longer be valid.
The analyst has listed four upside targets. The first is $0.0000168, which acted as a resistance level earlier this year. The second is $0.000022, which is the supply zone from February. The third is $0.000029, a historical resistance area. The final target is $0.000033419, which the analyst described as the top of the breakout range.
These levels are not guaranteed, but the analyst believes they are possible if SHIB continues to hold above support and if broader market conditions stay favorable.
RSI and MACD Support the Move
The Relative Strength Index (RSI) is a tool that measures whether a cryptocurrency is overbought or oversold. Values above 70 suggest the asset might be overbought, while values below 30 indicate it may be oversold. SHIB’s current RSI is 66.95. This means the token is approaching the overbought zone, but it still has room to move higher before hitting that level.
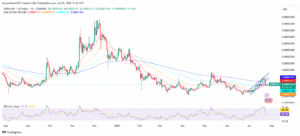
Another indicator, the Moving Average Convergence Divergence (MACD), tracks changes in trend direction and momentum. On SHIB’s chart, the MACD has formed a bullish crossover — a condition where the faster-moving average has crossed above the slower one. This supports the idea that SHIB is gaining upward momentum.
The price has also moved above the 20-day, 50-day, 100-day, and 200-day exponential moving averages. This alignment shows a shift in trend, with buyers currently in control.
SHIB Active Addresses Low, Volume Flat — On-Chain Momentum Has Yet to Catch Up
While the chart setup looks positive, on-chain metrics offer a more cautious picture. SHIB’s Market Value to Realized Value (MVRV) ratio is around –17.57%. This ratio compares the market price of the token to the average cost at which all tokens were last moved. A negative value means that most holders are sitting on unrealized losses. Historically, SHIB has seen price rebounds from similar MVRV levels.

However, daily active addresses remain low at around 3,000. The 30-day count has dropped to 77,500. These numbers are far below Shiba Inu’s earlier activity peaks from 2021 and early 2023. Despite the breakout, network engagement has not picked up meaningfully.
Transaction volume, which often confirms growing interest, is also flat. This shows that many traders may still be waiting on the sidelines. If volume fails to rise, the breakout could lose strength.

Shibarium — Shiba Inu’s Layer-2 blockchain — processed over 3.85 million transactions in the last 24 hours. This shows continued usage of the network. However, liquidity on Shibarium is falling. The total value locked across Shibarium DeFi protocols is just $1.8 million, down 8.13% from the day before. This is a significant drop from its early 2025 peak, when it held over $6 million.
High usage with low liquidity suggests that while people are transacting, there is not enough capital flowing into the ecosystem. Without new capital, it may be harder for SHIB’s price to hold up over time.
Supply Still Dominated by Whales
According to ownership data, 61.49% of Shiba Inu’s supply is held by large holders, often referred to as whales. Small traders, or retail holders, control just over 26% of the supply. Long-term holders — wallets that have held SHIB for more than a year — own about 12%.
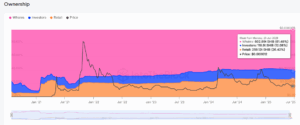
This level of whale control adds a risk factor. If large holders choose to sell during price rallies, SHIB could face sharp pullbacks. A more balanced distribution between whales and retail would give the price structure more stability.
The breakout from SHIB’s 8-month downtrend is confirmed on the chart. Price is holding above key support. Volume backed the breakout. Momentum indicators like the RSI and MACD suggest room for further upside. All major moving averages have turned positive.
But the on-chain data is less supportive. Network activity is weak. Transaction volume has not increased. Liquidity on Shibarium is low, and whales still dominate the supply.
The TradingView analyst’s price targets remain possible, but Shiba Inu may need more network growth and capital inflow to reach them. If support breaks or Bitcoin weakens, the current setup may fail. For now, SHIB remains in a valid breakout zone — but upside may depend on what happens off the chart as much as on it.
