
On May 26, 2025, X user @newstar0507 shared a SHIB/USDT chart showing a bull flag pattern forming on the daily timeframe. The price sits at $0.00001461, trading inside two downward-sloping white lines that shape the flag.
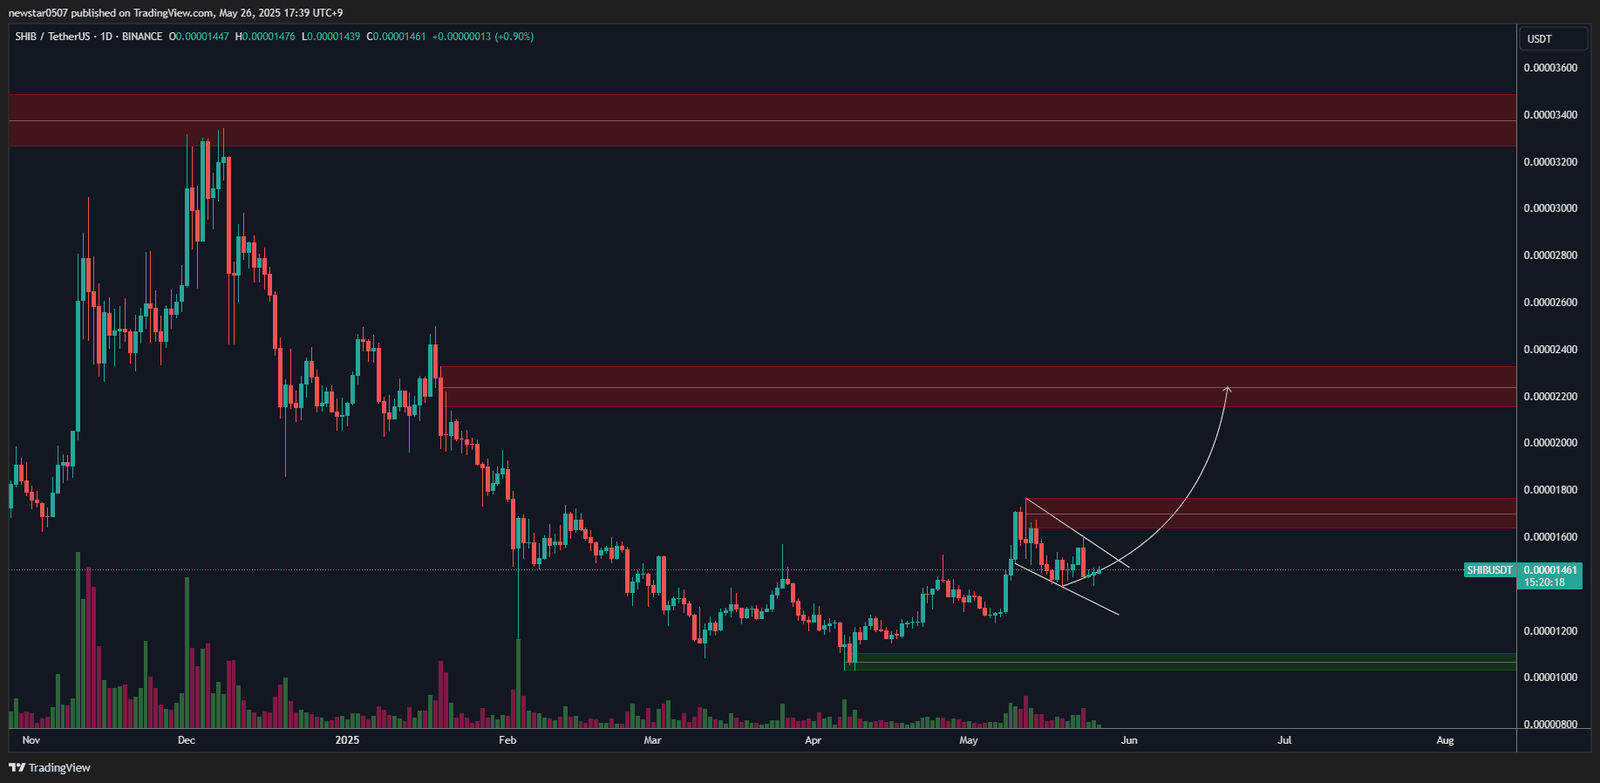
A bull flag pattern appears after a sharp upward move, called the flagpole. After that, price usually moves slightly lower or sideways within a narrow range, forming the flag. This structure often signals a pause before the uptrend continues. In this case, SHIB had a strong rally in early May and then entered a short-term pullback, creating the flag part.
If SHIB breaks above the upper trendline of this flag, the chart suggests a possible continuation of the rally. The projected target is around $0.000022, where a red zone indicates a strong area of selling pressure. A curved arrow on the chart shows this potential upward move.
The chart also shows price bouncing from the lower part of the flag, signaling growing buyer interest. If volume increases along with a breakout, this setup could confirm. Until then, the price remains inside the flag, waiting for direction.
SHIBA INU Bullish Momentum Grows as BBTrend Indicator Turns Positive
This BBTrend (Bollinger Band Trend) chart shows clear momentum reversal for SHIB. The indicator moved from deep red into strong green, signaling a shift from bearish to bullish pressure.
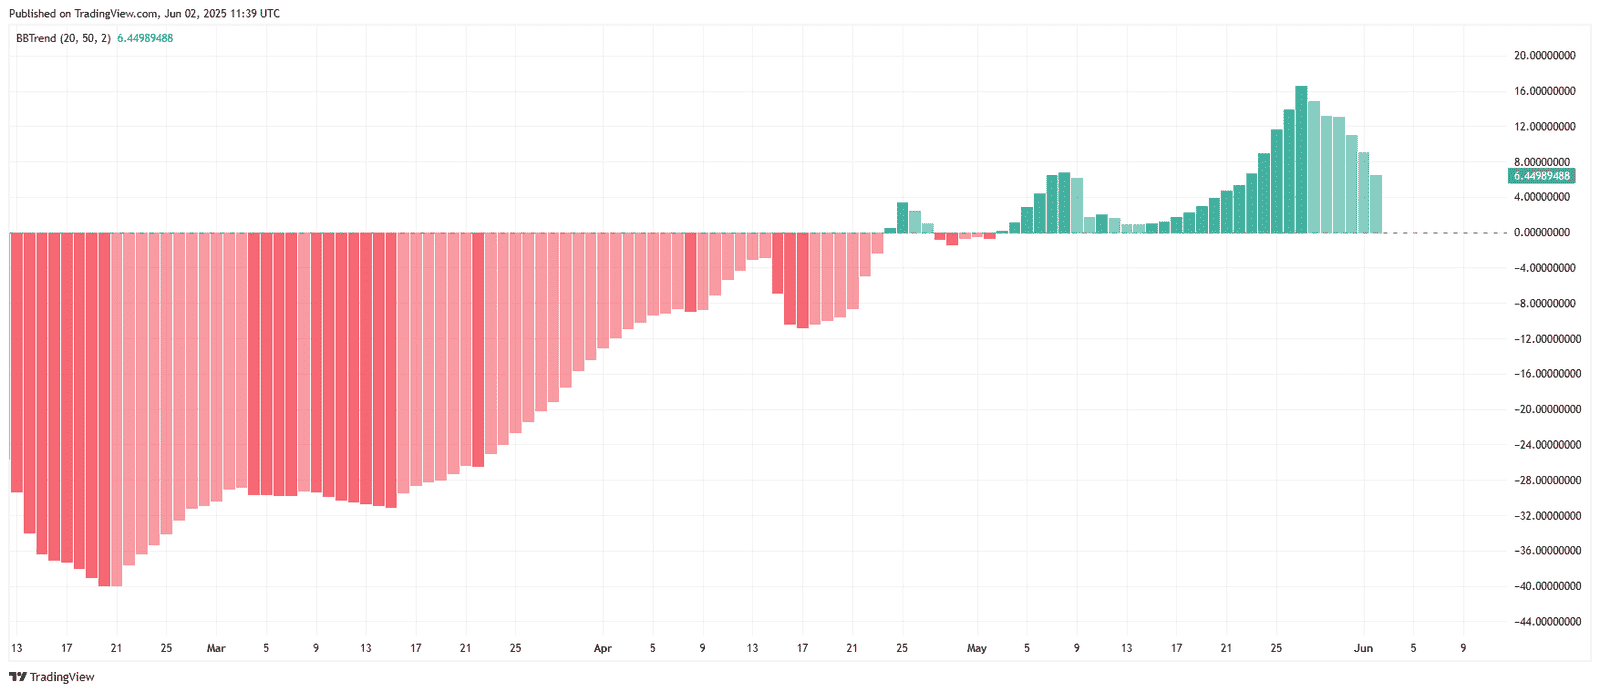
From mid-February through April, the histogram stayed negative. Bars were large and red, meaning sellers dominated. But by late April, selling started weakening. The bars became shorter and lighter in color.
In early May, green bars appeared for the first time. This marked a trend change. Since then, the green bars have grown steadily. That shows rising buying strength. By late May, the trend peaked near 17, confirming bullish control.
Now, the BBTrend value reads 6.45. Although the momentum has cooled slightly, the indicator remains well above zero. That suggests the uptrend is still active, even if slowing.
If green bars continue to grow again, it may confirm another leg up. If they shrink further and the bars turn red again, it could signal a weakening trend.
This chart supports the bull flag analysis shared earlier. Momentum has flipped in SHIB’s favor, and buyers are still leading the trend.
SHIB RSI Slips Below Neutral, Signals Weakening Momentum
This RSI (Relative Strength Index) chart shows that SHIB is losing strength. On June 2, 2025, the RSI value dropped to 37.77, placing it just above the oversold threshold of 30. The yellow line, which represents the RSI-based moving average, reads 47.31 and is now trending lower.
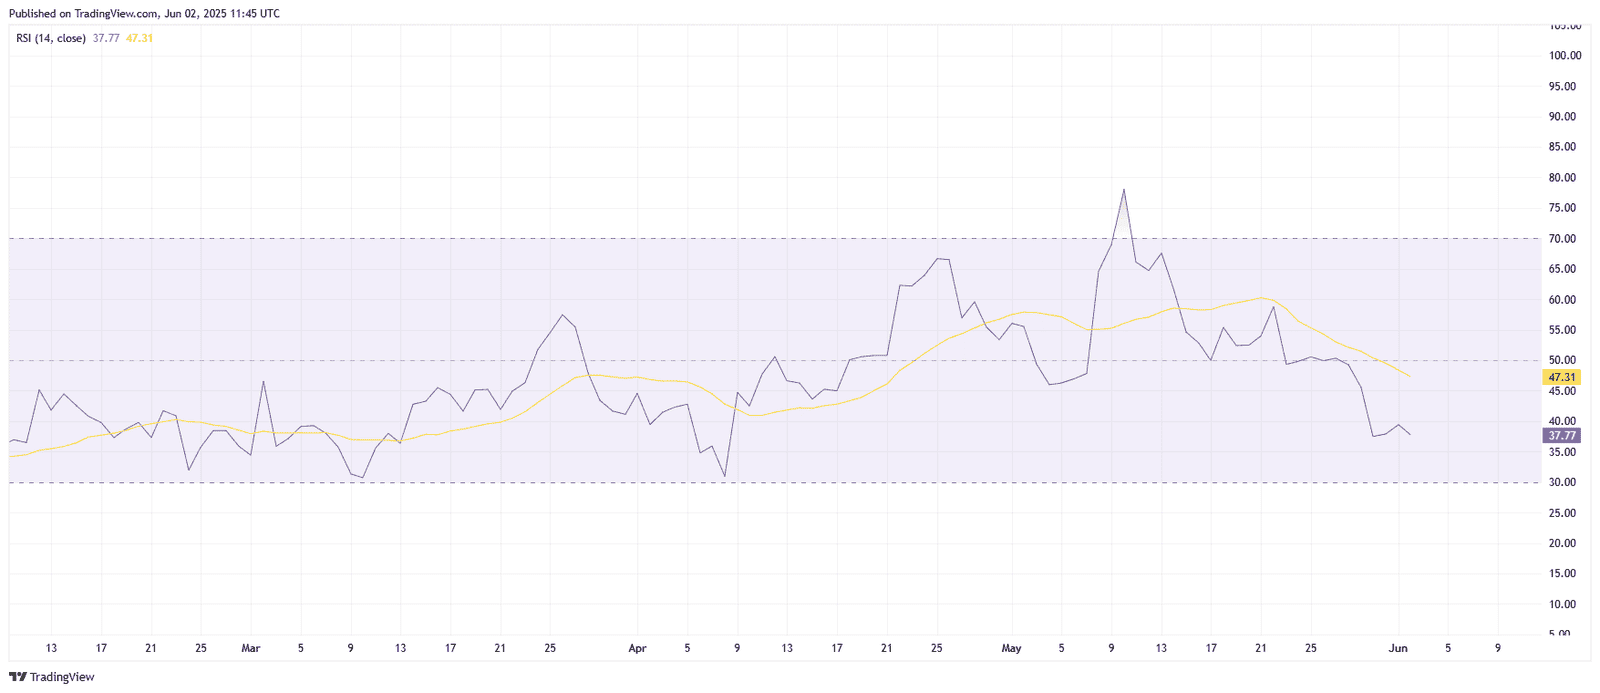
The RSI dropped below 50 in mid-May and has been declining since. This shift shows that buying momentum is fading while selling pressure is increasing. A reading below 50 usually confirms a bearish shift, and a drop near 30 suggests the asset is close to oversold conditions.
If RSI continues falling toward 30, it may reflect panic selling or exhaustion. However, if it rebounds from this level, it could mark the beginning of a recovery. For now, SHIB’s RSI shows weakness in momentum, in contrast with the BBTrend chart, which still leans bullish. This suggests that while overall trend strength exists, short-term buying power is softening.
SHIB Breaks Below Bollinger Midline, Tests Lower Band Support
This daily SHIBA INU /USDT chart uses Bollinger Bands to track volatility and price direction. As of June 2, 2025, SHIB trades at $0.00001277, just above the lower Bollinger Band at $0.00001261. The price dropped 1.39% on the day and closed well below the 20-day Simple Moving Average (SMA) line, now positioned at $0.00001427.
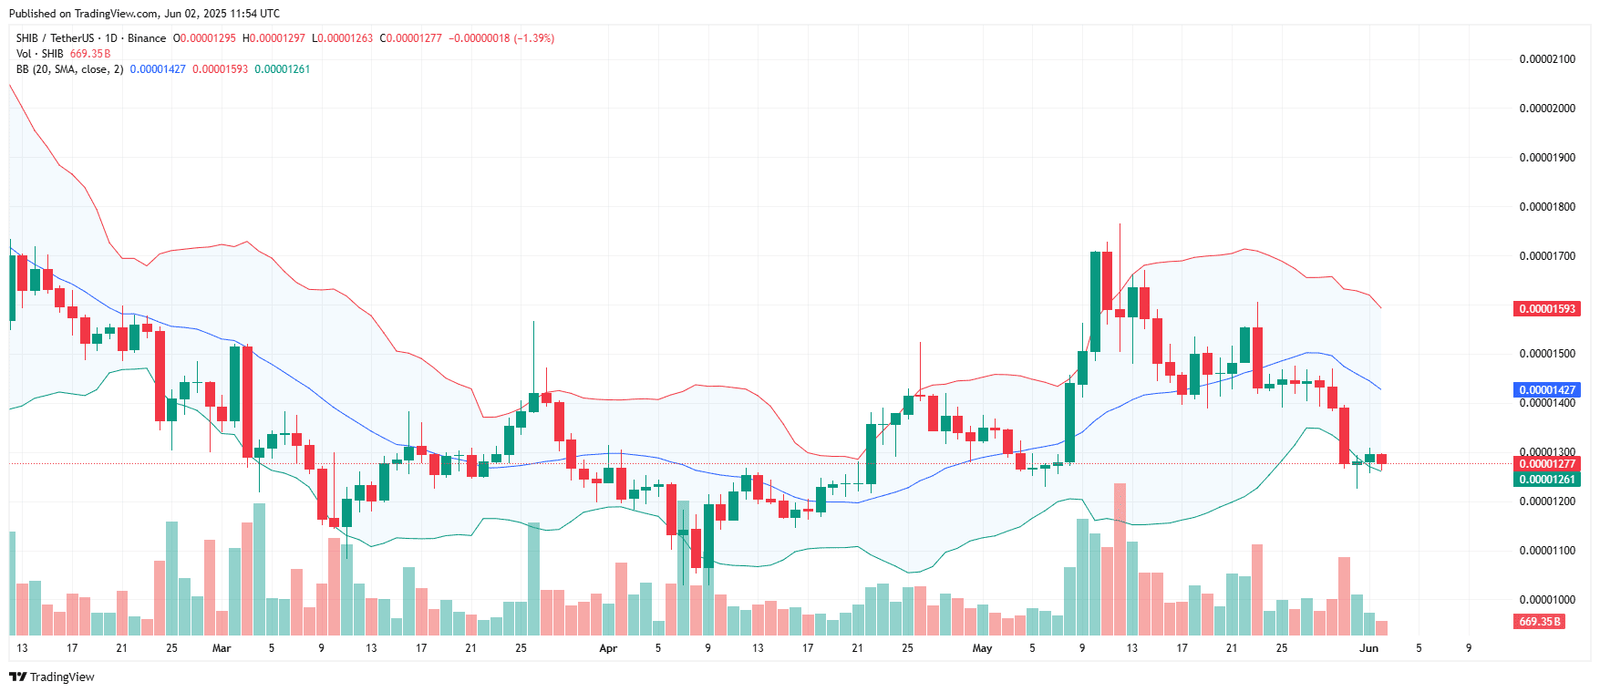
The Bollinger Bands show SHIB has lost upward momentum. After climbing near $0.00001700 in mid-May, the price reversed and fell below the midline. That shift usually signals weakening trend strength and opens the way for further downside movement.
Currently, the price is moving along the lower band, suggesting SHIB is testing support. If it breaks below the band with strong volume, more selling pressure could follow. If it bounces off this level, the midline around $0.00001427 may act as resistance again.
The narrowing shape of the bands earlier in May hinted at consolidation, but the recent widening shows that volatility has returned. SHIB is now in a critical spot. A rebound could stabilize the chart, while a breakdown risks deeper losses.
SHIBA INU DMI Chart Shows Bearish Pressure Outpacing Buyers
The DMI (Directional Movement Index) chart tracks the strength of bullish and bearish forces in SHIB’s price. As of June 2, 2025, the +DI (orange line) stands at 23.57, while the -DI (red line) reads 16.24. The ADX (blue line), which measures overall trend strength, is at 14.78.
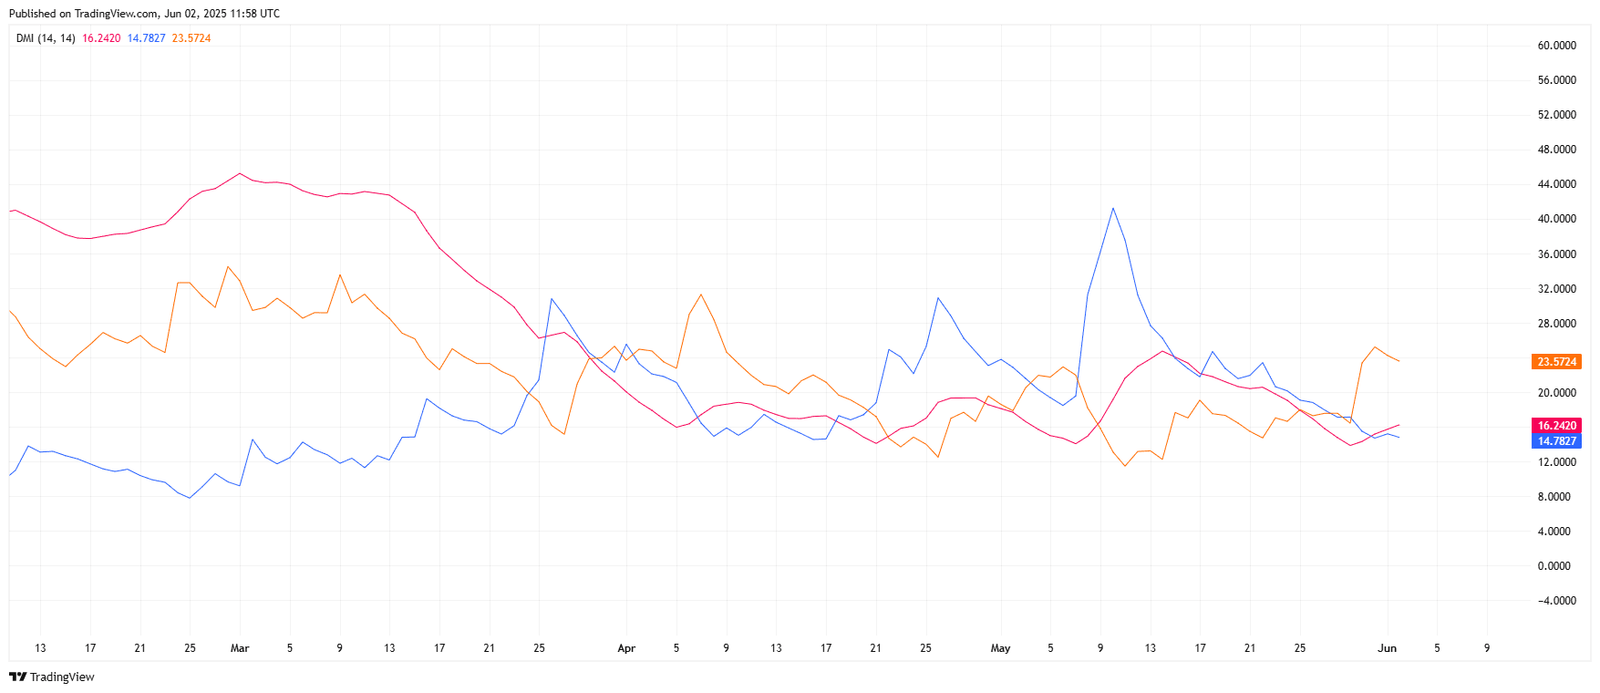
The orange +DI line recently spiked above the red -DI line. This crossover shows that buyers are slightly stronger than sellers right now. However, the ADX remains below 20, indicating the current trend lacks strong momentum.
Earlier in May, ADX climbed above 30 while +DI surged, confirming a strong bullish move. That strength faded by late May, and the ADX dropped sharply. While +DI remains above -DI, the gap is narrow, and both lines are still in a weak zone.
Right now, the DMI shows a mild bullish bias without a strong trend. If ADX rises again while +DI stays dominant, the chart may confirm new momentum. If -DI climbs back over +DI, bearish control could return. For now, the signals remain neutral to slightly bullish.
