
Shiba Inu (SHIB) is showing signs of a potential breakout, with its daily price chart forming a descending triangle pattern. This setup usually indicates that a major move—either upward or downward—is approaching. The pattern is formed when the price continues to make lower highs while repeatedly bouncing off a flat support level. As of March 25, SHIB is trading around $0.00001365 and is nearing the apex of this triangle.
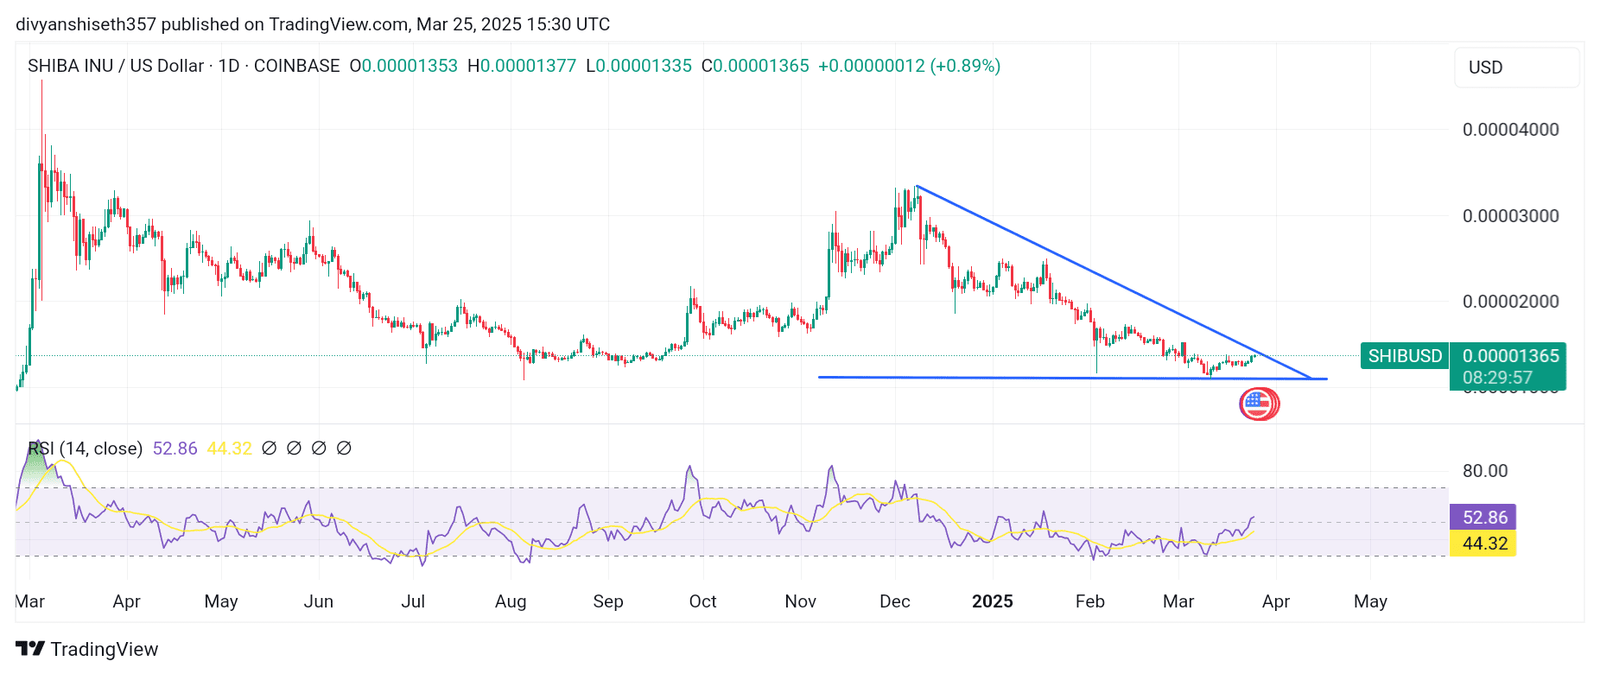
The descending triangle pattern often shows weakening buyer strength and can signal either a continuation of the downtrend or a sharp reversal if momentum shifts.
The Relative Strength Index (RSI), a momentum indicator that helps traders assess whether an asset is overbought or oversold, is currently reading at 52.86. This level is considered neutral, indicating that the recent selling pressure has eased. The RSI had previously dropped below 30, signaling oversold conditions. Since then, it has been gradually climbing, which shows improving momentum.
While the RSI does not yet suggest strong buying activity, its recovery indicates that bearish momentum may be slowing down. A continued rise in RSI above 60 could confirm renewed bullish interest, especially if supported by rising trading volume.
Over 83% of SHIB Holders Are in Loss
On-chain data paints a challenging picture for current SHIB investors. According to the data from IntoTheBlock, 83.33% of SHIB holders are currently “out of the money”—meaning they purchased their tokens at a higher price than the current market value. Only 13.29% of holders are in profit, and 3.38% are at break-even.
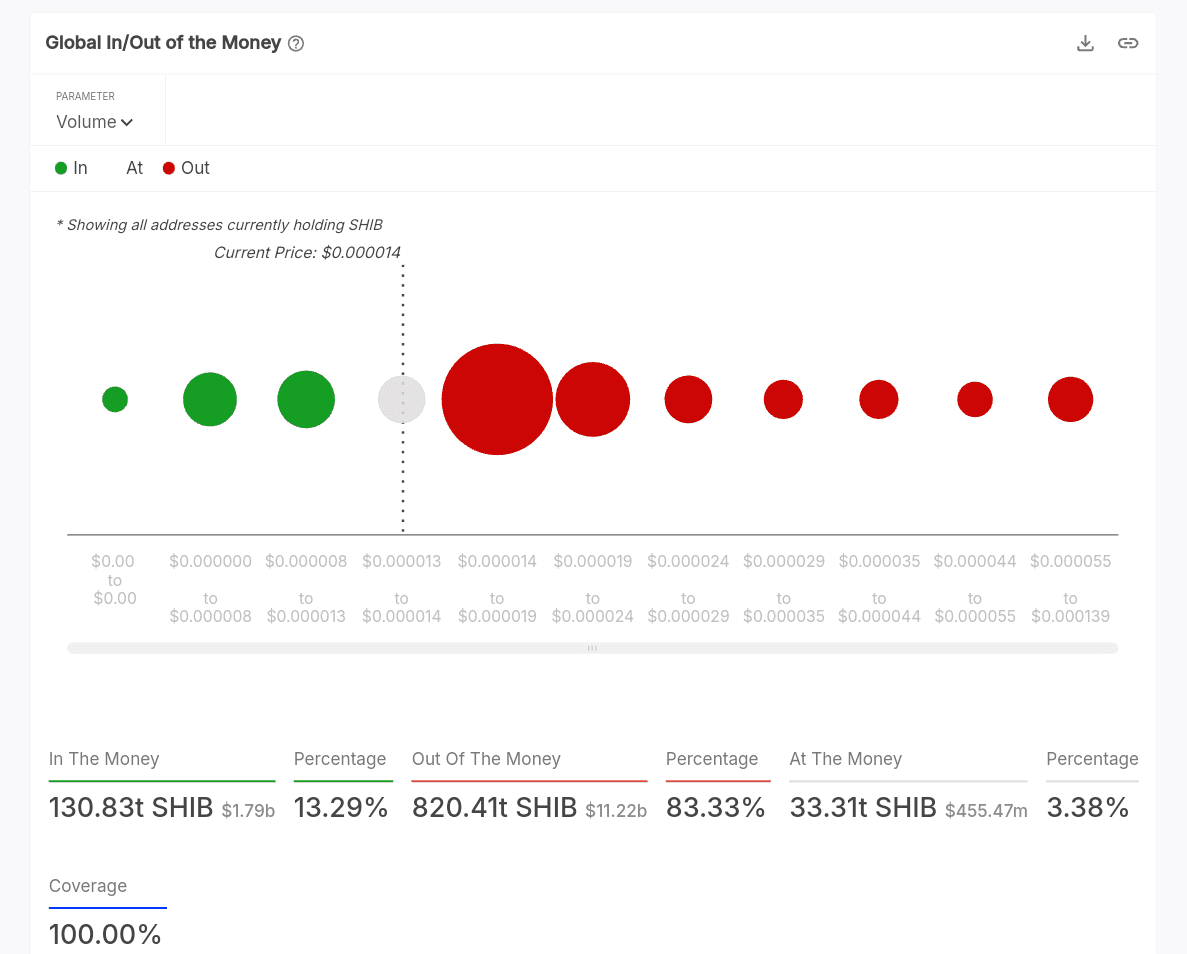
The current SHIB price is around $0.000014, which sits just below several large clusters of wallet addresses that are bought in the $0.000014 to $0.000019 range. These holders may act as resistance if the price starts to climb, as many may be looking to exit their positions as soon as they break even.
This concentration of unprofitable wallets suggests a fragile recovery path. Even minor rallies could trigger profit-taking or loss-cutting behavior, potentially putting downward pressure on the price.
Key Levels to Watch as Market Awaits Breakout
SHIB now sits at a critical technical juncture. If the price can break above the descending resistance line—estimated around $0.00001400—it could trigger a short-term rally. The next resistance levels to watch would be around $0.00001600 and $0.00001800, where many holders previously bought in.
On the other hand, if SHIB breaks below the triangle’s flat support at $0.00001150, it could signal a continuation of the downward trend. The next major support would then lie near $0.00000980, a level not tested since late 2023.
With the chart tightening and momentum indicators showing early signs of recovery, the next few days could determine SHIB’s short-term direction. A confirmed breakout—especially one backed by strong trading volume—could bring much-needed relief to holders. Until then, the coin remains under pressure, both technically and sentimentally.
