
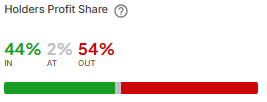
Shiba Inu (SHIB) surged 15% over the past week, but on-chain data shows most holders remain at a loss. According to IntoTheBlock, only 44% of SHIB holders are in profit, while 54% are sitting on unrealized losses. Another 2% are at break-even.
Many investors entered during the meme coin’s 2021 peak, when SHIB reached its all-time high. IntoTheBlock data confirms that around 80% of current holders have held SHIB for more than 12 months. In contrast, just 2% joined in the last 30 days.
Old Investors Still Underwater
The massive gap between SHIB’s current price and its 2021 top—an 83% drop—explains the high percentage of red-zone holders. SHIB gained value recently, but its performance still lags behind other altcoins like Stellar, XRP, and Hedera, which have seen larger price increases during the same timeframe.
Despite limited recovery for long-term holders, some signs point to growing bullish momentum. On-chain data from CryptoQuant shows negative netflows from exchanges over the past week. This indicates that investors are moving SHIB off trading platforms into self-custody, a typical sign of reduced short-term selling pressure.
SHIB’s daily chart from World of Charts shows a confirmed breakout above a long-term descending trendline that had capped price movement since late 2023. This breakout also cleared a strong horizontal resistance zone marked between 0.00001150 and 0.00001250. The zone had rejected multiple rallies in previous months but now acts as support, indicating a potential shift in trend direction.

The rounded base formation preceding the breakout suggests gradual accumulation. This type of price structure often precedes sustained upward movement, especially when accompanied by breakout from both diagonal and horizontal resistance zones. The black arrow sketched on the chart illustrates the expected continuation path if bullish momentum persists.
If SHIB maintains its position above the red resistance-turned-support area, the next logical target could be the zone around 0.00003000. That level aligns with a past consolidation area seen in early 2024 and could serve as a mid-term ceiling. While volume is not visible on the chart, the breakout’s sharpness implies increased buying pressure. Holding above support remains key to validating this bullish setup.
SHIB Forms Rising Wedge, Chart Hints at Possible Pullback
On July 18, 2025, a 4-hour chart of Shiba Inu (SHIB/USDT) created by user tayatatev on TradingView shows a rising wedge formation. The price has been climbing steadily while confined between two converging upward-sloping trendlines, creating the shape of a rising wedge. This structure is widely recognized as a bearish reversal pattern in technical analysis.

A rising wedge forms when the price creates higher highs and higher lows, but the slope of the highs is less steep than the slope of the lows. This indicates a loss of momentum and typically signals that buyers are exhausting. While the price may continue rising within the wedge for a while, a breakdown below the lower trendline often triggers a correction.
In this chart, SHIB has already touched the upper resistance and appears to be consolidating near the support line. If the pattern confirms and the price breaks down from the wedge, a drop of up to 10 percent could follow. That would bring SHIB down toward the region around 0.00001340, just above the 50-period Exponential Moving Average (EMA) marked in blue. The horizontal blue support zone also coincides with this potential correction level, making it a key area to watch.
SHIB RSI Nears Overbought Zone, Momentum Slows
The 14-day Relative Strength Index (RSI) for Shiba Inu (SHIB), shown on this July 18 charton TradingView, is approaching the overbought threshold. The RSI line sits at 67.29, with the moving average at 64.32. Although still below the commonly watched level of 70, the indicator suggests that bullish momentum may be fading.

The RSI measures the speed and magnitude of recent price changes to determine whether an asset is overbought or oversold. Values above 70 often signal that an asset is overbought and could face short-term selling pressure. Readings below 30 suggest the opposite—potential undervaluation or buying interest.
While SHIB has not yet crossed the overbought line, its RSI touched higher levels earlier this week and has since cooled slightly. The soft decline in the RSI while price holds steady hints at weakening buying strength. If the RSI falls further without a sharp price drop, it may confirm divergence, often an early signal of a reversal or slowdown in the trend. The indicator’s behavior should be watched closely in the next sessions to confirm direction.
SHIB Balance of Power Remains Weak Despite Positive Print
This Balance of Power (BoP) chart for Shiba Inu (SHIB), created on July 18, shows a positive reading of 0.17. While this value indicates that buyers currently have a slight edge, the broader trend reveals a lack of sustained momentum from either side.

The Balance of Power indicator measures the strength of buying versus selling pressure over a specific period. Values above zero suggest buyers are in control, while values below zero show that sellers dominate. The higher the reading, the more aggressive the buying force is compared to selling.
Despite the recent uptick, the BoP line remains volatile and inconsistent. Spikes quickly revert, and most readings over the past several weeks have hovered close to the neutral line. This choppy behavior implies indecision in the market and signals that neither bulls nor bears have a firm grip. Unless BoP rises with stronger consistency, this indicator does not yet confirm a shift in broader sentiment.
