Shiba Inu (SHIB) reclaimed the $0.000013 level on July 15, with one analyst forecasting a breakout toward $0.000025 — a 90% gain from current prices.
SHIB traded at $0.00001378 as of July 16, up 5.7% on the day, following a trendline breakout confirmed on the daily chart. Analyst Thomas Reid said SHIB is “holding support above the $0.000013 level,” and suggested a move to $0.000025 is likely if momentum continues.
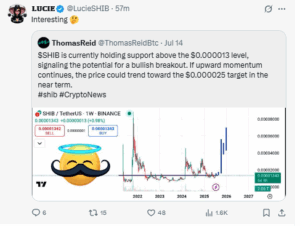
The forecast comes as SHIB’s price structure shows early signs of strength on the daily chart.
RSI Approaches Overbought as Trend Reverses
The Relative Strength Index (RSI) climbed to 67.4, approaching the overbought threshold of 70. RSI is a momentum indicator used by traders to measure buying strength.
The breakout follows weeks of consolidation near $0.00001213 and $0.00001150 — both of which acted as prior support. Trading volume rose to $292 million on July 16, the highest in three weeks, reinforcing the bullish view.
Momentum indicators aren’t the only signs turning bullish. SHIB has also flipped key trend levels across its moving averages.
SHIB to USD now trades above its 20-day, 50-day, and 100-day exponential moving averages (EMAs). These trend indicators, clustered between $0.00001256 and $0.00001262, were previously acting as dynamic resistance.

Notably, the next critical level is the 200-day EMA, currently at $0.00001450. A daily close above this level could open the path toward $0.0000175 — a prior rejection zone — followed by the analyst’s $0.000025 target.
SHIB Futures Open Interest Climbs Alongside Price
Traders in the derivatives market appear to be reacting to this setup.
SHIB futures open interest surged nearly 40% since early July. The increase in open interest in addition to rising price and RSI suggests new long positions are being opened, indicating renewed trader participation.
While short-term traders add leverage, long-term holders have also quietly accumulated during SHIB’s consolidation phase.
Addresses holding SHIB for over one year have now surpassed 1 million. In contrast, short-term traders holding for less than one month have fallen to multi-year lows.
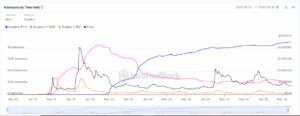
This shift in holder composition shows increased long-term conviction, which often accompanies price base formation.
Beyond price metrics, SHIB’s ecosystem remains active on-chain.
Shibarium Records Over 4M Daily Transactions
SHIB’s Layer-2 network, Shibarium, continues to see steady activity. Specifically, as of July 16, the network processed 4.23 million daily transactions, with total wallet addresses exceeding 267 million.
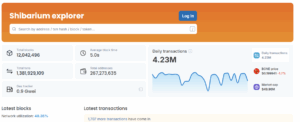
The network’s utilization rate stands near 48%, with an average 5-second block time and low gas costs around 0.9 Gwei. This signals efficient usage across the ecosystem.
With both price and utility metrics aligned, SHIB now faces key levels that could determine whether this breakout sustains.
Immediate resistance lies at the 200-day EMA ($0.00001450). Additionally, bulls will need to reclaim $0.000015 and $0.0000175 before attempting a push toward $0.000025, the analyst’s target.
Moreover, support remains at $0.00001213 and $0.00001150. Both zones held during June’s consolidation and continue to serve as downside protection.
