
Shiba Inu’s core team says the Shibarium Ethereum bridge remains offline following the Sept. 12 validator-key exploit. The developers framed the pause as necessary while they complete security reviews and third-party audits.
Project communications outline immediate containment steps taken after the incident. The team rotated keys, tightened custody, and restricted bridge operations as investigators mapped the attack path.
As of today, no reopen date is public. Updates will continue through official channels while forensic work and external assessments proceed.
What the developers say happened
In a detailed post, developer Kaal Dhairya said unauthorized validator signing power enabled a malicious checkpoint/exit that withdrew multiple assets through the PoS bridge. The note attributes the vector to short-lived stake amplification combined with forged proofs.
The update accepts leadership responsibility for key management during Shibarium’s early stages and says decentralization will increase as part of the fix. The team also highlights strengthened controls and custody policies now in progress.
Documentation adds that findings may evolve as audits complete. The developers committed to sharing clarifications via an FAQ that tracks the investigation’s latest state.
On-chain fallout tied to the attacker
Addresses linked to the incident have moved and sold portions of siphoned tokens in recent days, according to ecosystem tracking. Coverage this week specifically flagged disposal of BAD (Bad Idea AI) holdings attributed to the bridge attacker.
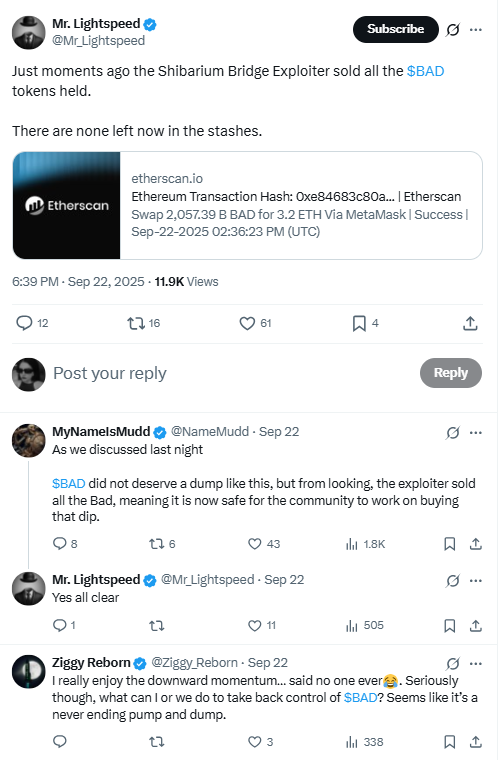
Earlier team notes also referenced sales of other assets from the exploit flow, including ETH and SHIB, while the bridge stays paused. These movements form part of the wider forensic picture.
Authorities and external specialists are engaged, though the project has not published recovery specifics. The standing message focuses on hardening, monitoring, and documentation first, then resuming operations.
Tooling keeps shipping: ShibaSwap upgrade
Separate from the bridge incident, the ShibaSwap DEX recently rolled out a refresh. The release unifies trading, liquidity, and analytics, and emphasizes multi-chain routing across major networks.
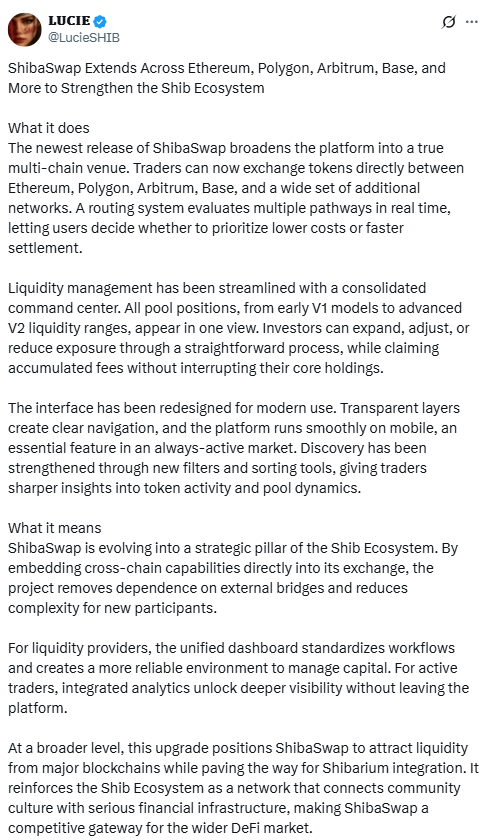
Community posts describe the redesign as a usability push meant to streamline core actions for ecosystem users. The update landed ahead of this week’s security communications.
The live ShibaSwap site continues to advertise swaps and liquidity features as normal, underscoring that broader tooling remains active while bridge remediation proceeds.
What’s next
Near-term milestones revolve around audits, validator controls, and publishing clearer reopen criteria for the bridge. The team has kept timelines open until those steps finish.
Ecosystem channels are steering users to official posts for status changes and FAQs. That approach aims to reduce rumor-based updates while technical work concludes.
For now, the operational story remains two-track: incident response around the bridge and continued delivery on products like ShibaSwap. Further details are expected as third-party reviews wrap.
Altseason chart claims SHIB and altcoins could outperform
A viral post says SHIB and other altcoins are set for a major rally. The post cites a monthly TradingView ratio that compares the total crypto market cap excluding the top ten to Bitcoin. It highlights run-ups in 2017 and 2021 and marks a similar climb for 2025.
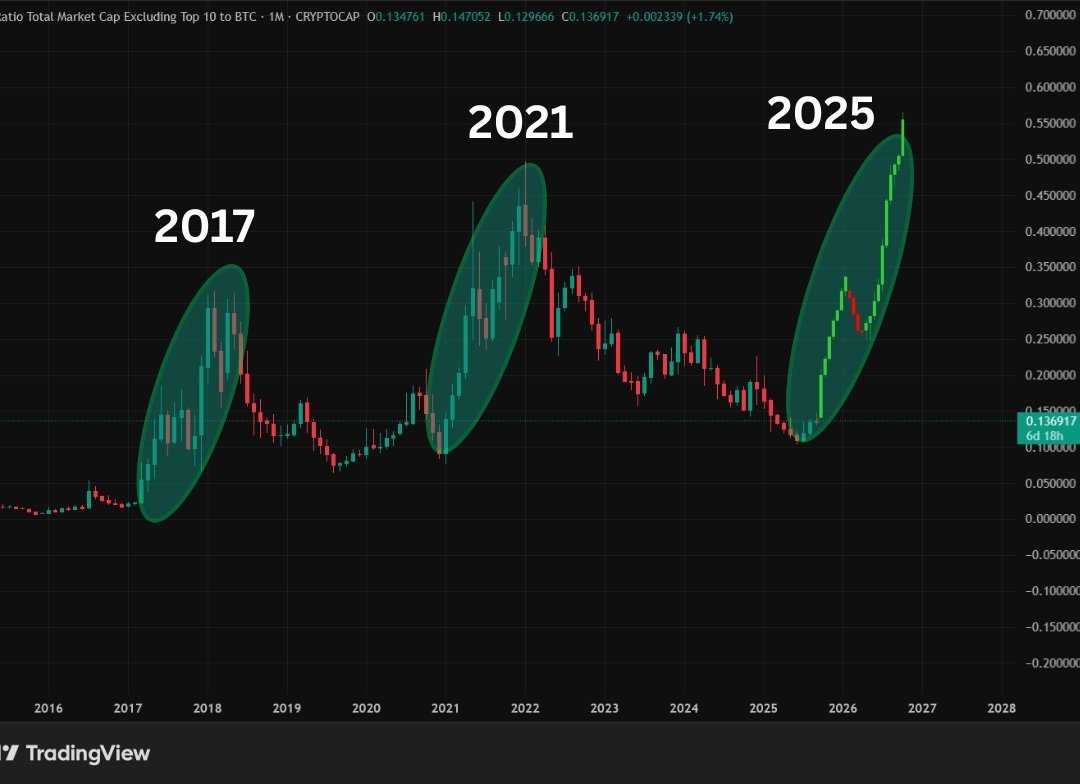
The chart tracks relative performance. When the line rises, smaller caps gain value against Bitcoin. Therefore, the author frames the move as an early altseason signal. The timeframe is monthly, so each candle compresses a full month of trading into one bar.
Context matters. Liquidity, Bitcoin dominance, and ETF flows often steer this ratio. Regulatory news and exchange conditions can change capital rotation. History shows two prior surges, yet the sample size remains small. As a result, the pattern suggests a setup but does not confirm broad outperformance by itself.
Chart flags potential SHIB breakout setup
A new post from SHIB Possessor presents a weekly chart that frames Shiba Inu inside a long descending trendline above a broad “major weekly support” band. The chart suggests buyers continue to defend that base while price compresses toward the trendline. It portrays a possible breakout scenario if SHIB closes above the horizontal resistance drawn near the prior range highs.
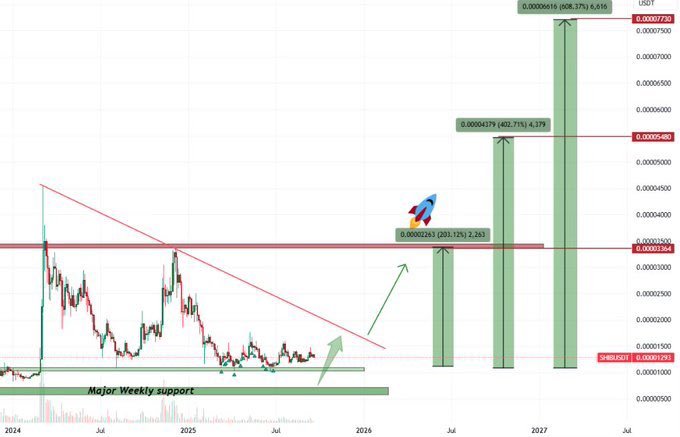
The graphic also maps several upside targets as vertical projection bars. These targets sit above the marked resistance and appear staggered to reflect successive extension levels. The author pairs the projections with arrows from the support area, implying a path that first reclaims resistance and then advances toward the higher targets.
However, the setup depends on confirmation. The chart implies that a weekly close above the trendline and horizontal cap would validate the breakout idea, while sustained trading back inside the support band would keep the range intact. As always, liquidity, market breadth, and Bitcoin dominance can influence whether altcoin breakouts hold after initial moves.
SHIB slips below a rising wedge; path points to 0.00001942 (+66%)
Shiba Inu’s SHIB/USDT daily chart, created on Sept. 26, 2025, shows price breaking below a rising wedge drawn from the late-June higher lows to the late-July peak. A rising wedge forms when price climbs inside two up-sloping, converging trendlines while momentum fades; it often resolves lower as demand weakens near resistance. Here, candles closed under the wedge’s lower boundary after several rejections at the descending top line, confirming the break.
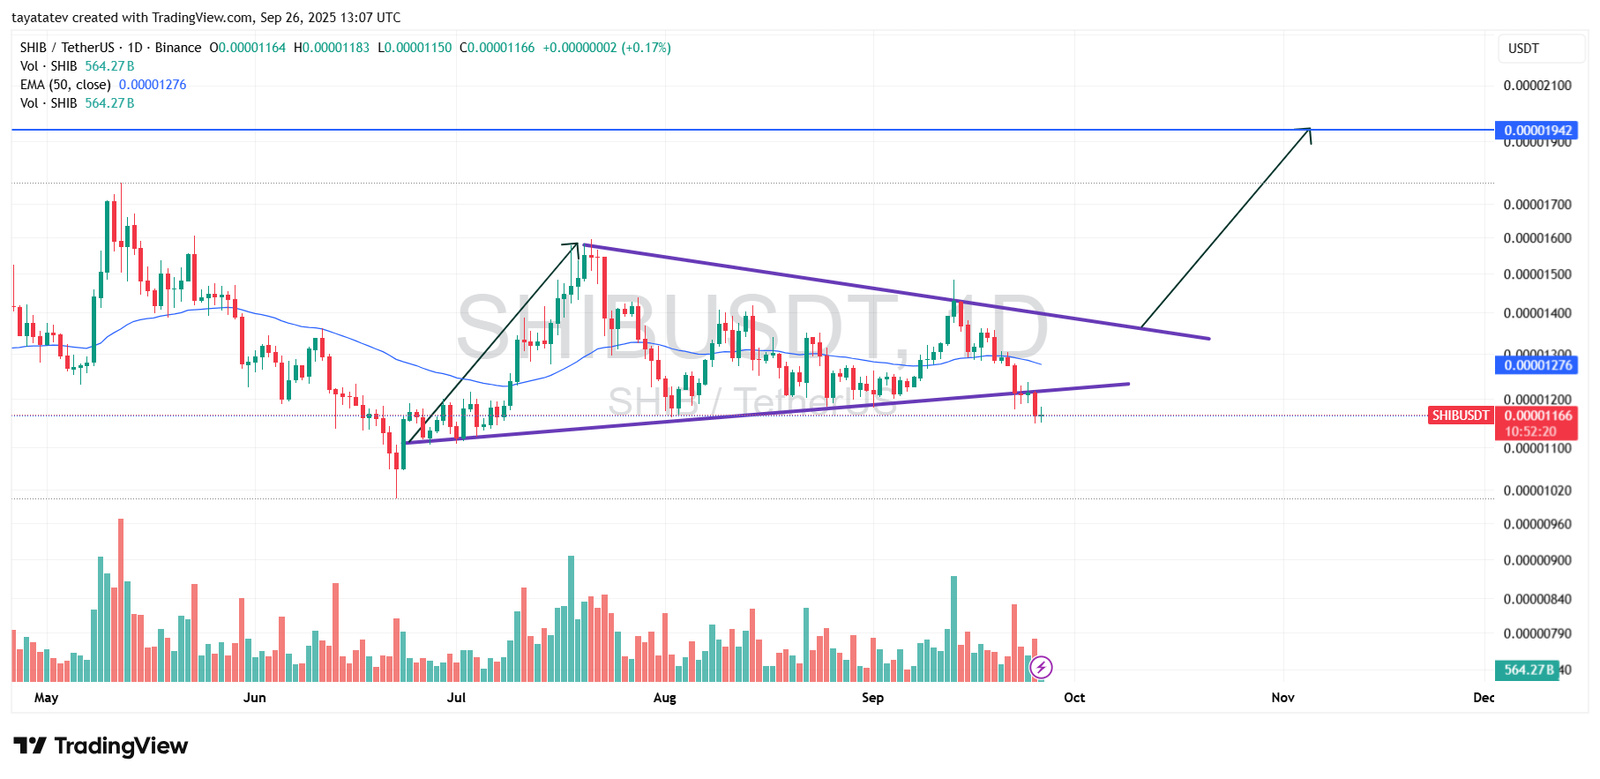
However, context matters. The move occurred during a volatile market session, with wide intraday ranges and heavier sell volume than average. As a result, the breakdown can overshoot support before price mean-reverts. The 50-day exponential moving average sits near 0.00001276 and now acts as the first level to reclaim. A decisive close back above the broken wedge line would signal absorption and reduce downside follow-through.
Measured risk-reward still favors a recovery attempt. From the current print around 0.00001166, the charted projection and prior reaction zone align near 0.00001942, which stands roughly 66% higher. That target matches the horizontal level highlighted on the chart and coincides with supply from June. If buyers retake the 50-day average and clear the descending upper wedge line, momentum can rotate toward that 0.00001942 objective while volume confirms the push. Failure to regain 0.00001276 would keep price inside a choppy base and delay the move.
