The Solana ecosystem faced a major legal development as a former Pump.fun developer pleaded guilty to stealing nearly $2 million in SOL. The individual, identified as Jarett Dunn, admitted in a London court that he used his position to exploit vulnerabilities within the memecoin launch platform.
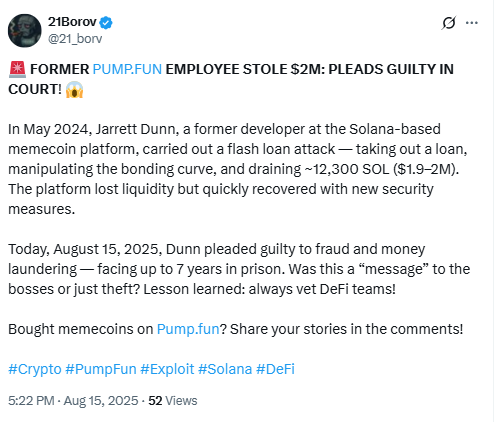
Authorities revealed that while Dunn personally gained around $2 million, the total estimated damage exceeded $12.8 million, affecting thousands of users who had participated in Pump.fun-based token launches. The case highlighted ongoing risks in Solana’s fast-growing memecoin sector, where platforms often scale quickly without rigorous security measures.
Dunn now awaits sentencing, with prosecutors pushing for a prison term of more than seven years. His guilty plea marks one of the most significant Solana-related fraud cases to date and underscores the importance of security audits in decentralized application development.
DeFi Development Corp Expands Solana Treasury
Institutional exposure to Solana continued to rise after DeFi Development Corp announced an additional purchase of 110,000 SOL, worth nearly $22 million. This acquisition brought the company’s total Solana holdings to 1,420,173 SOL, with an estimated market value of about $273 million.
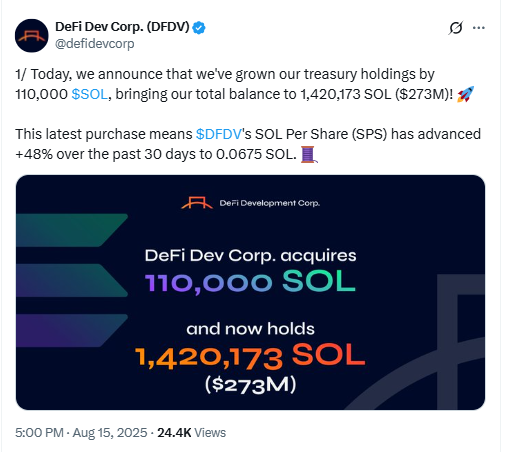
Executives confirmed that all newly acquired tokens were immediately staked to generate yield, reflecting long-term confidence in Solana’s staking economy. The move boosted the company’s SOL per share (SPS) metric by 9%, an important internal benchmark used to measure treasury performance. Over the past thirty days, that figure has increased by 48%, indicating aggressive accumulation during a period of heightened institutional interest.
Market analysts note that DeFi Development Corp has emerged as one of the largest corporate holders of Solana, positioning itself as a key institutional player in the ecosystem. Its strategy of consistent treasury expansion and staking suggests a commitment to using Solana not only as a speculative asset but also as an income-generating tool through yield.
Solana DeFi and Wallet Growth Accelerates
Beyond corporate adoption, Solana’s on-chain metrics demonstrated strong momentum in the second quarter of 2025. A report from Messari confirmed that the network’s DeFi total value locked (TVL) increased by 30.4% quarter-over-quarter, reaching $8.6 billion. Lending and liquidity protocols played the biggest role in this expansion, with Kamino maintaining its lead through a 33.9% growth rate over the same period.
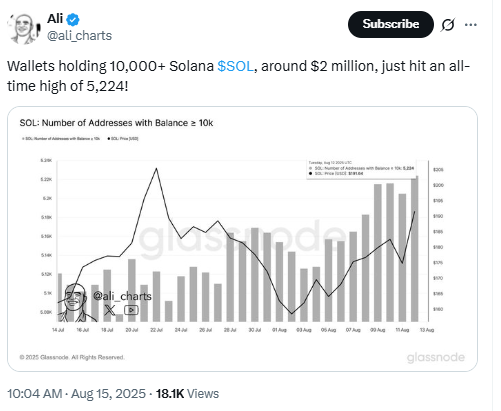
At the same time, Solana recorded a sharp increase in wallet creation, with the number of active wallets surpassing 3 million. This milestone reflects rising retail adoption alongside institutional participation, showing that the network is expanding on multiple fronts. The growth in wallets also indicates an increasing number of unique participants using Solana for DeFi, NFTs, and gaming applications.
The combination of DeFi expansion and rising wallet adoption reinforces Solana’s positioning as one of the most active ecosystems in the blockchain sector. Analysts highlight that these fundamentals provide strong backing for long-term development, even as the network continues to address scalability and security challenges.
Debate Over Solana’s “Mainnet Beta” Status
Alongside technical progress, Solana’s development philosophy became the subject of renewed debate. Blockchain engineer Dean Little (@deanmlittle) publicly supported keeping the network under its current “mainnet beta” designation, arguing that the label preserves flexibility for ongoing upgrades.
Little explained that finalizing Solana’s status too early could risk slowing innovation and limit the team’s ability to implement necessary changes. This perspective aligns with Solana Labs’ long-standing approach, which treats the beta phase as a permanent framework for iterative improvement rather than a temporary stage before final release.
While some critics view the “beta” tag as a sign of immaturity, Solana’s developers emphasize that it reflects the project’s philosophy of continuous iteration. The debate highlights the balance between presenting Solana as a stable, institutional-grade network and maintaining agility to adapt to rapidly evolving demands in blockchain infrastructure.
The Solana ecosystem today reflects both its strengths and its vulnerabilities. The Pump.fun theft case demonstrated the risks facing fast-moving projects in the network’s memecoin sector. At the same time, institutional accumulation by DeFi Development Corp, coupled with strong DeFi and wallet growth, signaled expanding confidence and adoption. Finally, the mainnet beta debate revealed the project’s unique stance on balancing stability with innovation as it scales.
Solana Trades Within a Consolidation Channel as Momentum Shifts
The Solana chart dated August 16, 2025, shows that the token is moving inside a clear horizontal consolidation channel. This type of channel forms when the price repeatedly bounces between parallel support and resistance levels without breaking out in either direction. The outlined structure begins in mid-July and remains intact through mid-August, signaling indecision in market sentiment.
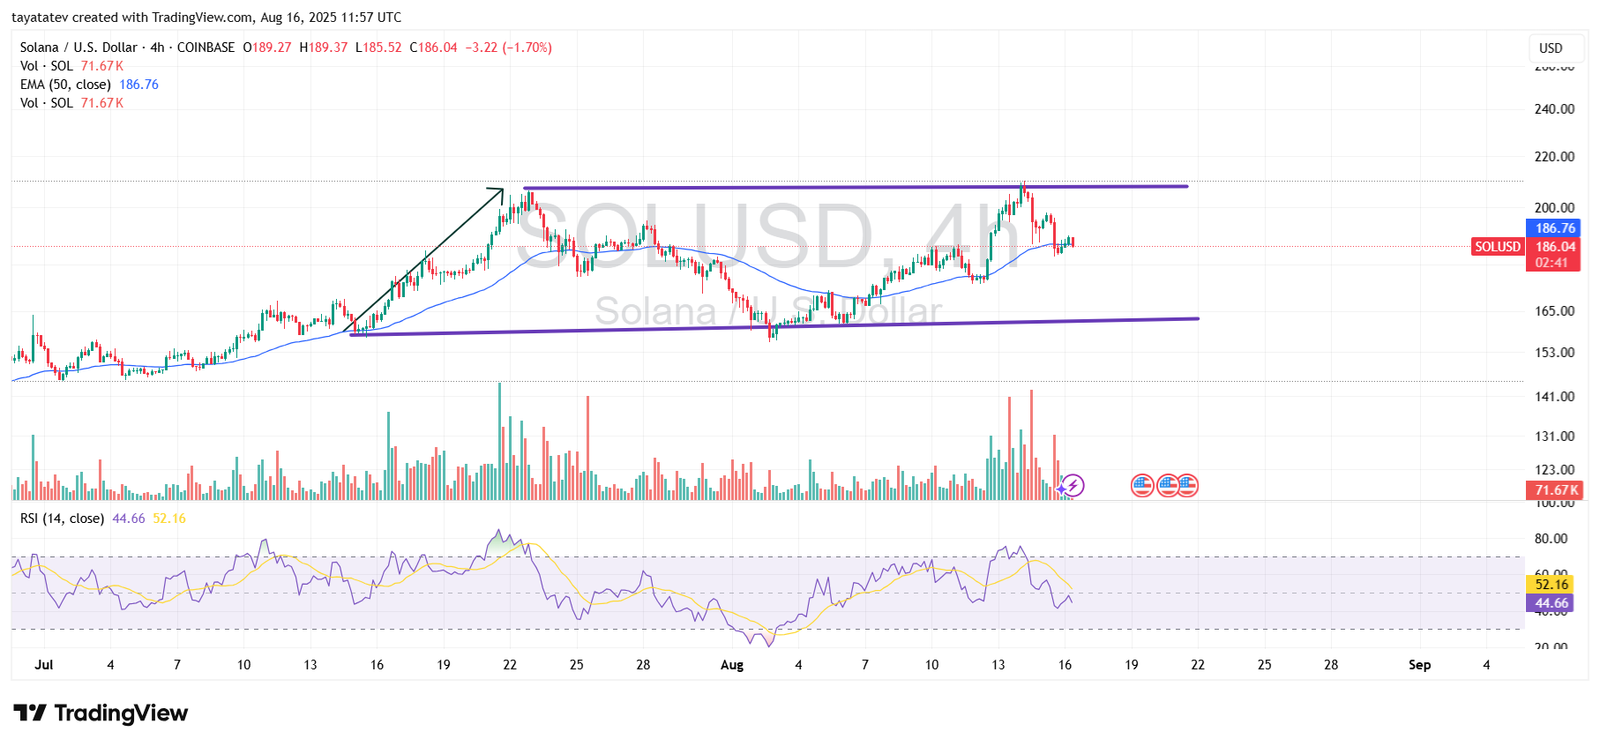
The upper boundary of the channel stands near $220. This zone has acted as strong resistance many times. Each time Solana tested it, sellers stepped in. They pushed the price lower.
The lower boundary sits around $165. Here, buyers consistently defended the level. Each decline stopped as demand increased. These two levels now shape the sideways movement.
The chart also shows the 50-period EMA at $186.76. This line works as dynamic support. Solana trades almost at this EMA after pulling back from the $220 resistance. Holding above it could spark another push higher. However, a break below could open the way to more downside.
Volume data adds more context. Trading volume rises sharply when Solana touches the channel’s edges. Yet it contracts when price stays in the middle. This shows hesitation among traders. Meanwhile, the RSI sits in the mid-40s. It signals neither overbought nor oversold conditions. This neutral reading supports the consolidation view.
Looking forward, Solana faces two clear paths. If the token holds above the EMA and builds momentum, it may test the $220 resistance again. A breakout above, with stronger volume, could end the consolidation channel. That would allow higher targets. But if sellers gain control and push price below $186, attention will turn back to $165. A breakdown there would confirm a bearish continuation and deepen losses.
For now, the $165–$220 channel defines Solana’s trade. Support and resistance continue to balance each other. The next decisive move depends on which boundary breaks first.
Solana MACD Signals Cooling Momentum After Strong Swings
The Solana chart dated August 16, 2025, presents the MACD (Moving Average Convergence Divergence) indicator, which tracks momentum shifts. The chart shows that Solana recently moved from a strong bullish phase into weakening momentum, suggesting that buyers are losing strength after weeks of volatility.
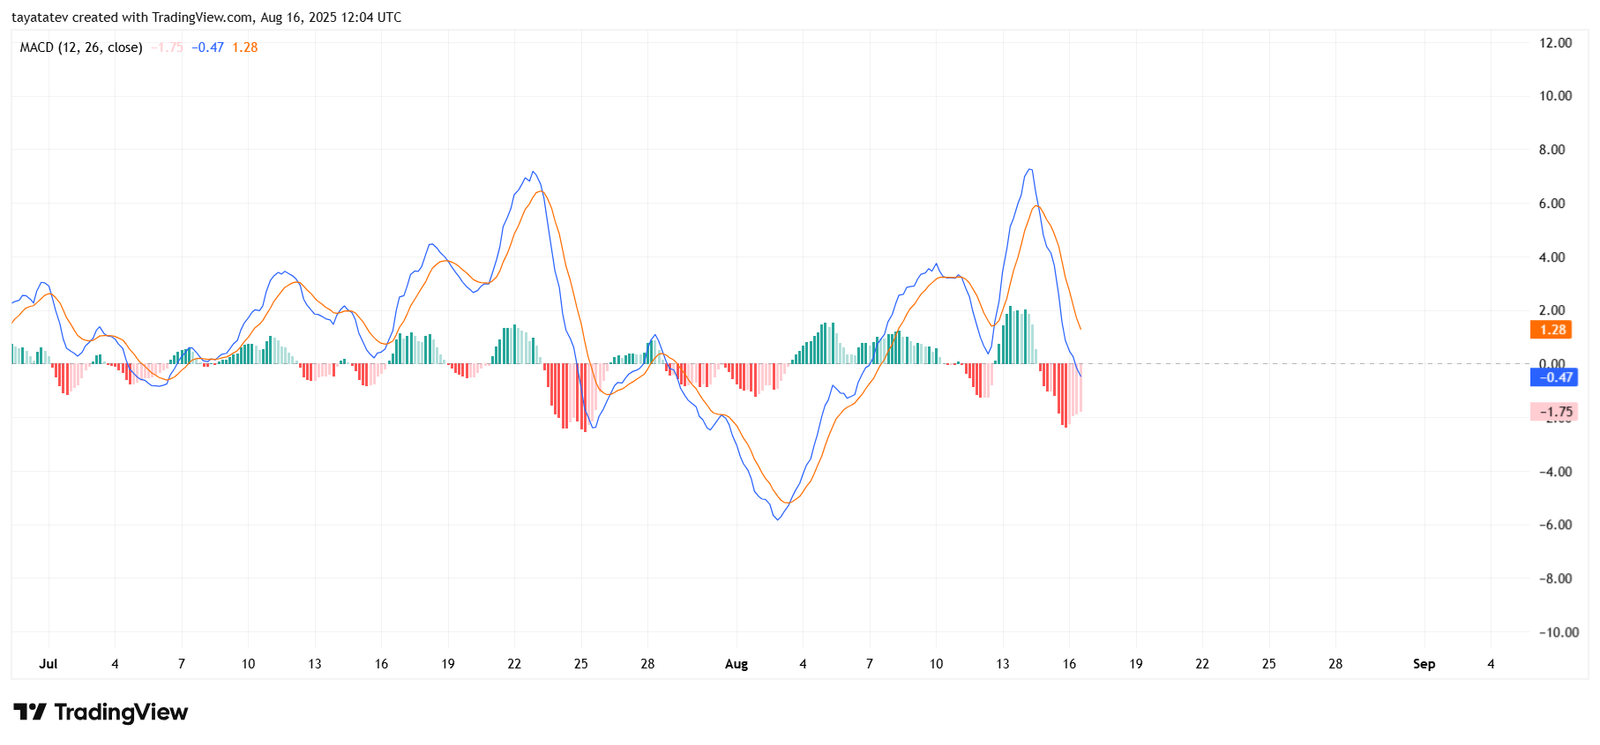
Earlier in August, the MACD line moved above the signal line. This created a bullish crossover. At the same time, Solana pushed toward the $220 resistance zone. The histogram bars turned green. They also expanded sharply. This confirmed strong buying momentum.
However, momentum changed quickly. The MACD line rolled over. It crossed back below the signal line. This created a bearish crossover. Now the histogram bars are red. They show growing downward momentum.
The MACD values also confirm this shift. The MACD line reads -0.47. The signal line stands at 1.28. The histogram shows -1.75. These readings indicate that bearish pressure dominates. This matches the recent rejection at $220, where sellers defended resistance.
In recent weeks, momentum has shifted repeatedly. During July, bullish and bearish swings alternated often. Each breakout attempt met resistance. Each dip found support. The MACD therefore moved around the zero line again and again. This pattern reflects Solana’s consolidation channel between $165 and $220.
Looking ahead, momentum may stay weak. The red histogram bars could extend further. If that happens, Solana may drop toward the channel’s mid-range. It may also retest the $186 support near the 50 EMA.
However, buyers could return. If the MACD line rises back above the signal line, momentum would shift upward again. In that case, Solana could make another move toward the $220 resistance zone.
The current MACD structure indicates a pause in bullish momentum rather than a fully established downtrend. Traders will watch closely whether Solana stabilizes near support or if bearish momentum expands into a deeper correction.
