
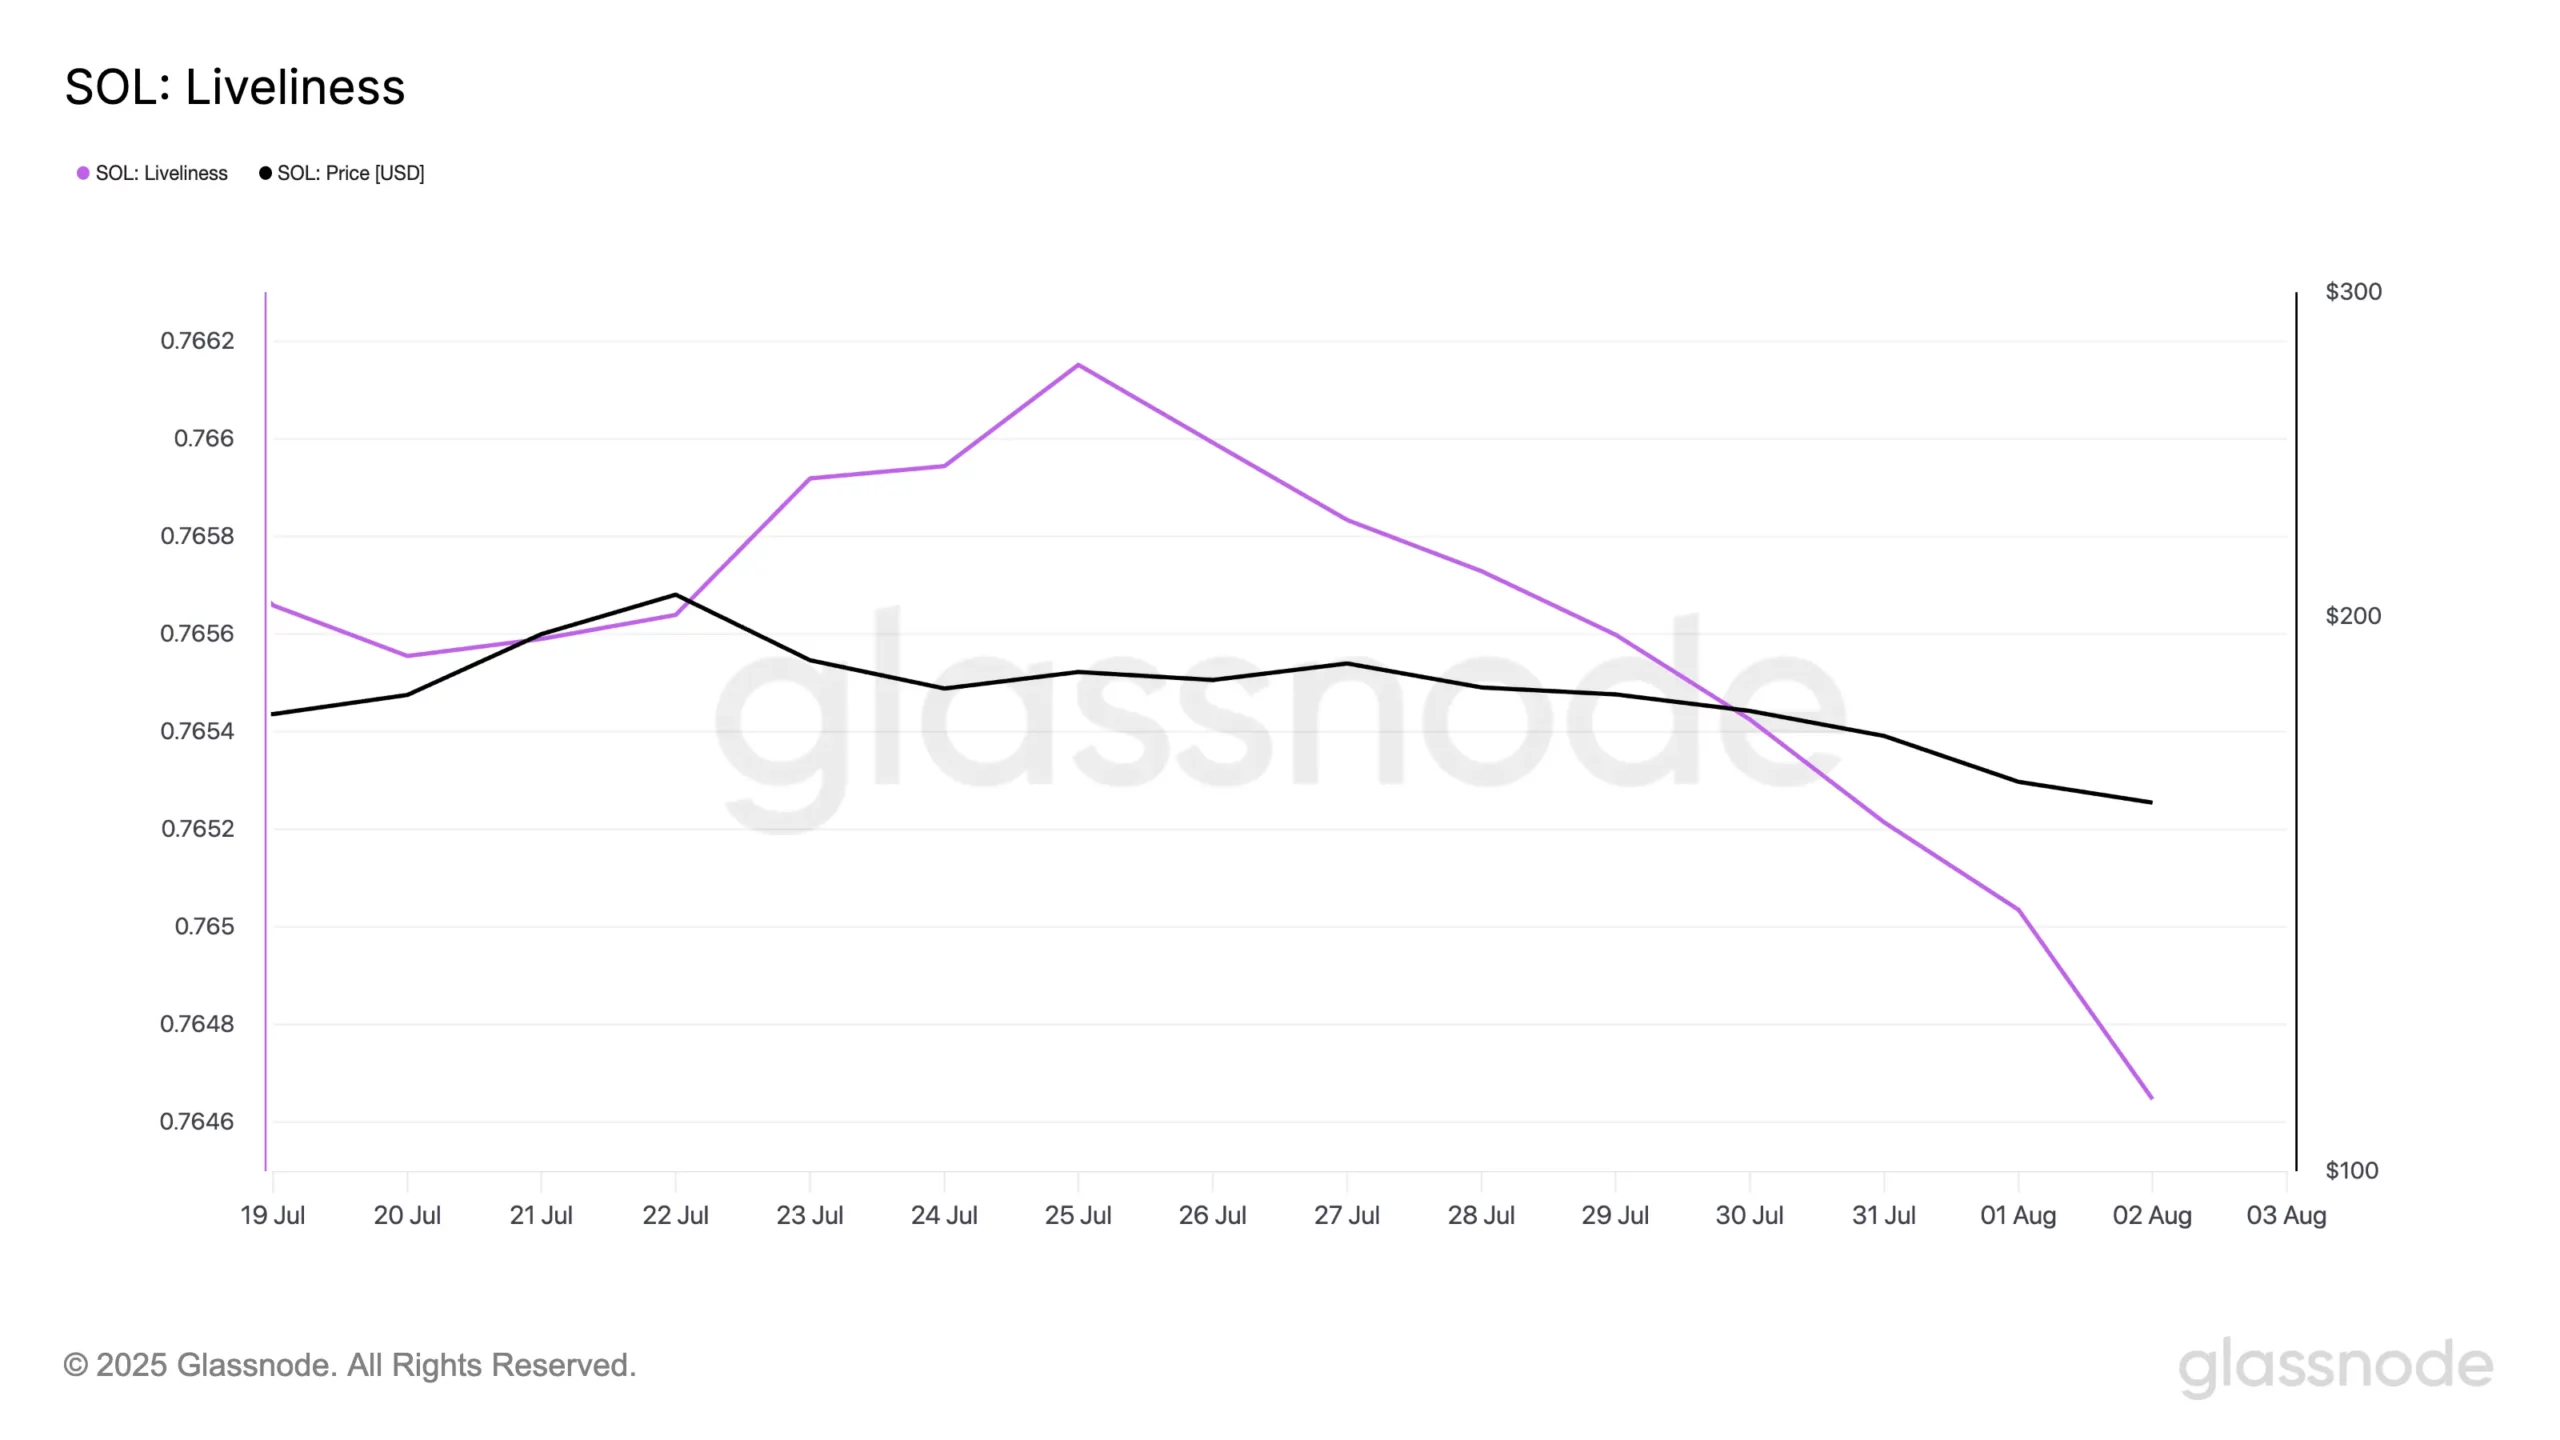
Long-term holders (LTHs) are steadily increasing their Solana (SOL) positions, while short-term traders continue to sell. This shift is evident in Solana’s Liveliness, which has declined consistently since July 25.
According to Glassnode, Liveliness dropped to a weekly low of 0.76 on August 2, confirming reduced sell-offs among SOL’s long-term holders. This metric tracks the movement of dormant tokens by comparing coin days destroyed to total coin days accumulated. When it rises, it signals profit-taking by long-term holders. However, its recent decline shows that these investors are moving tokens off exchanges and holding them instead.
Hodler Net Position Change Confirms Accumulation
Since July 30, Solana’s Hodler Net Position Change has recorded a steady increase. Glassnode data shows this metric, which measures the 30-day change in supply held by LTHs, has climbed 102% over four days. This rise confirms that more coins are flowing into long-term storage despite muted price action.
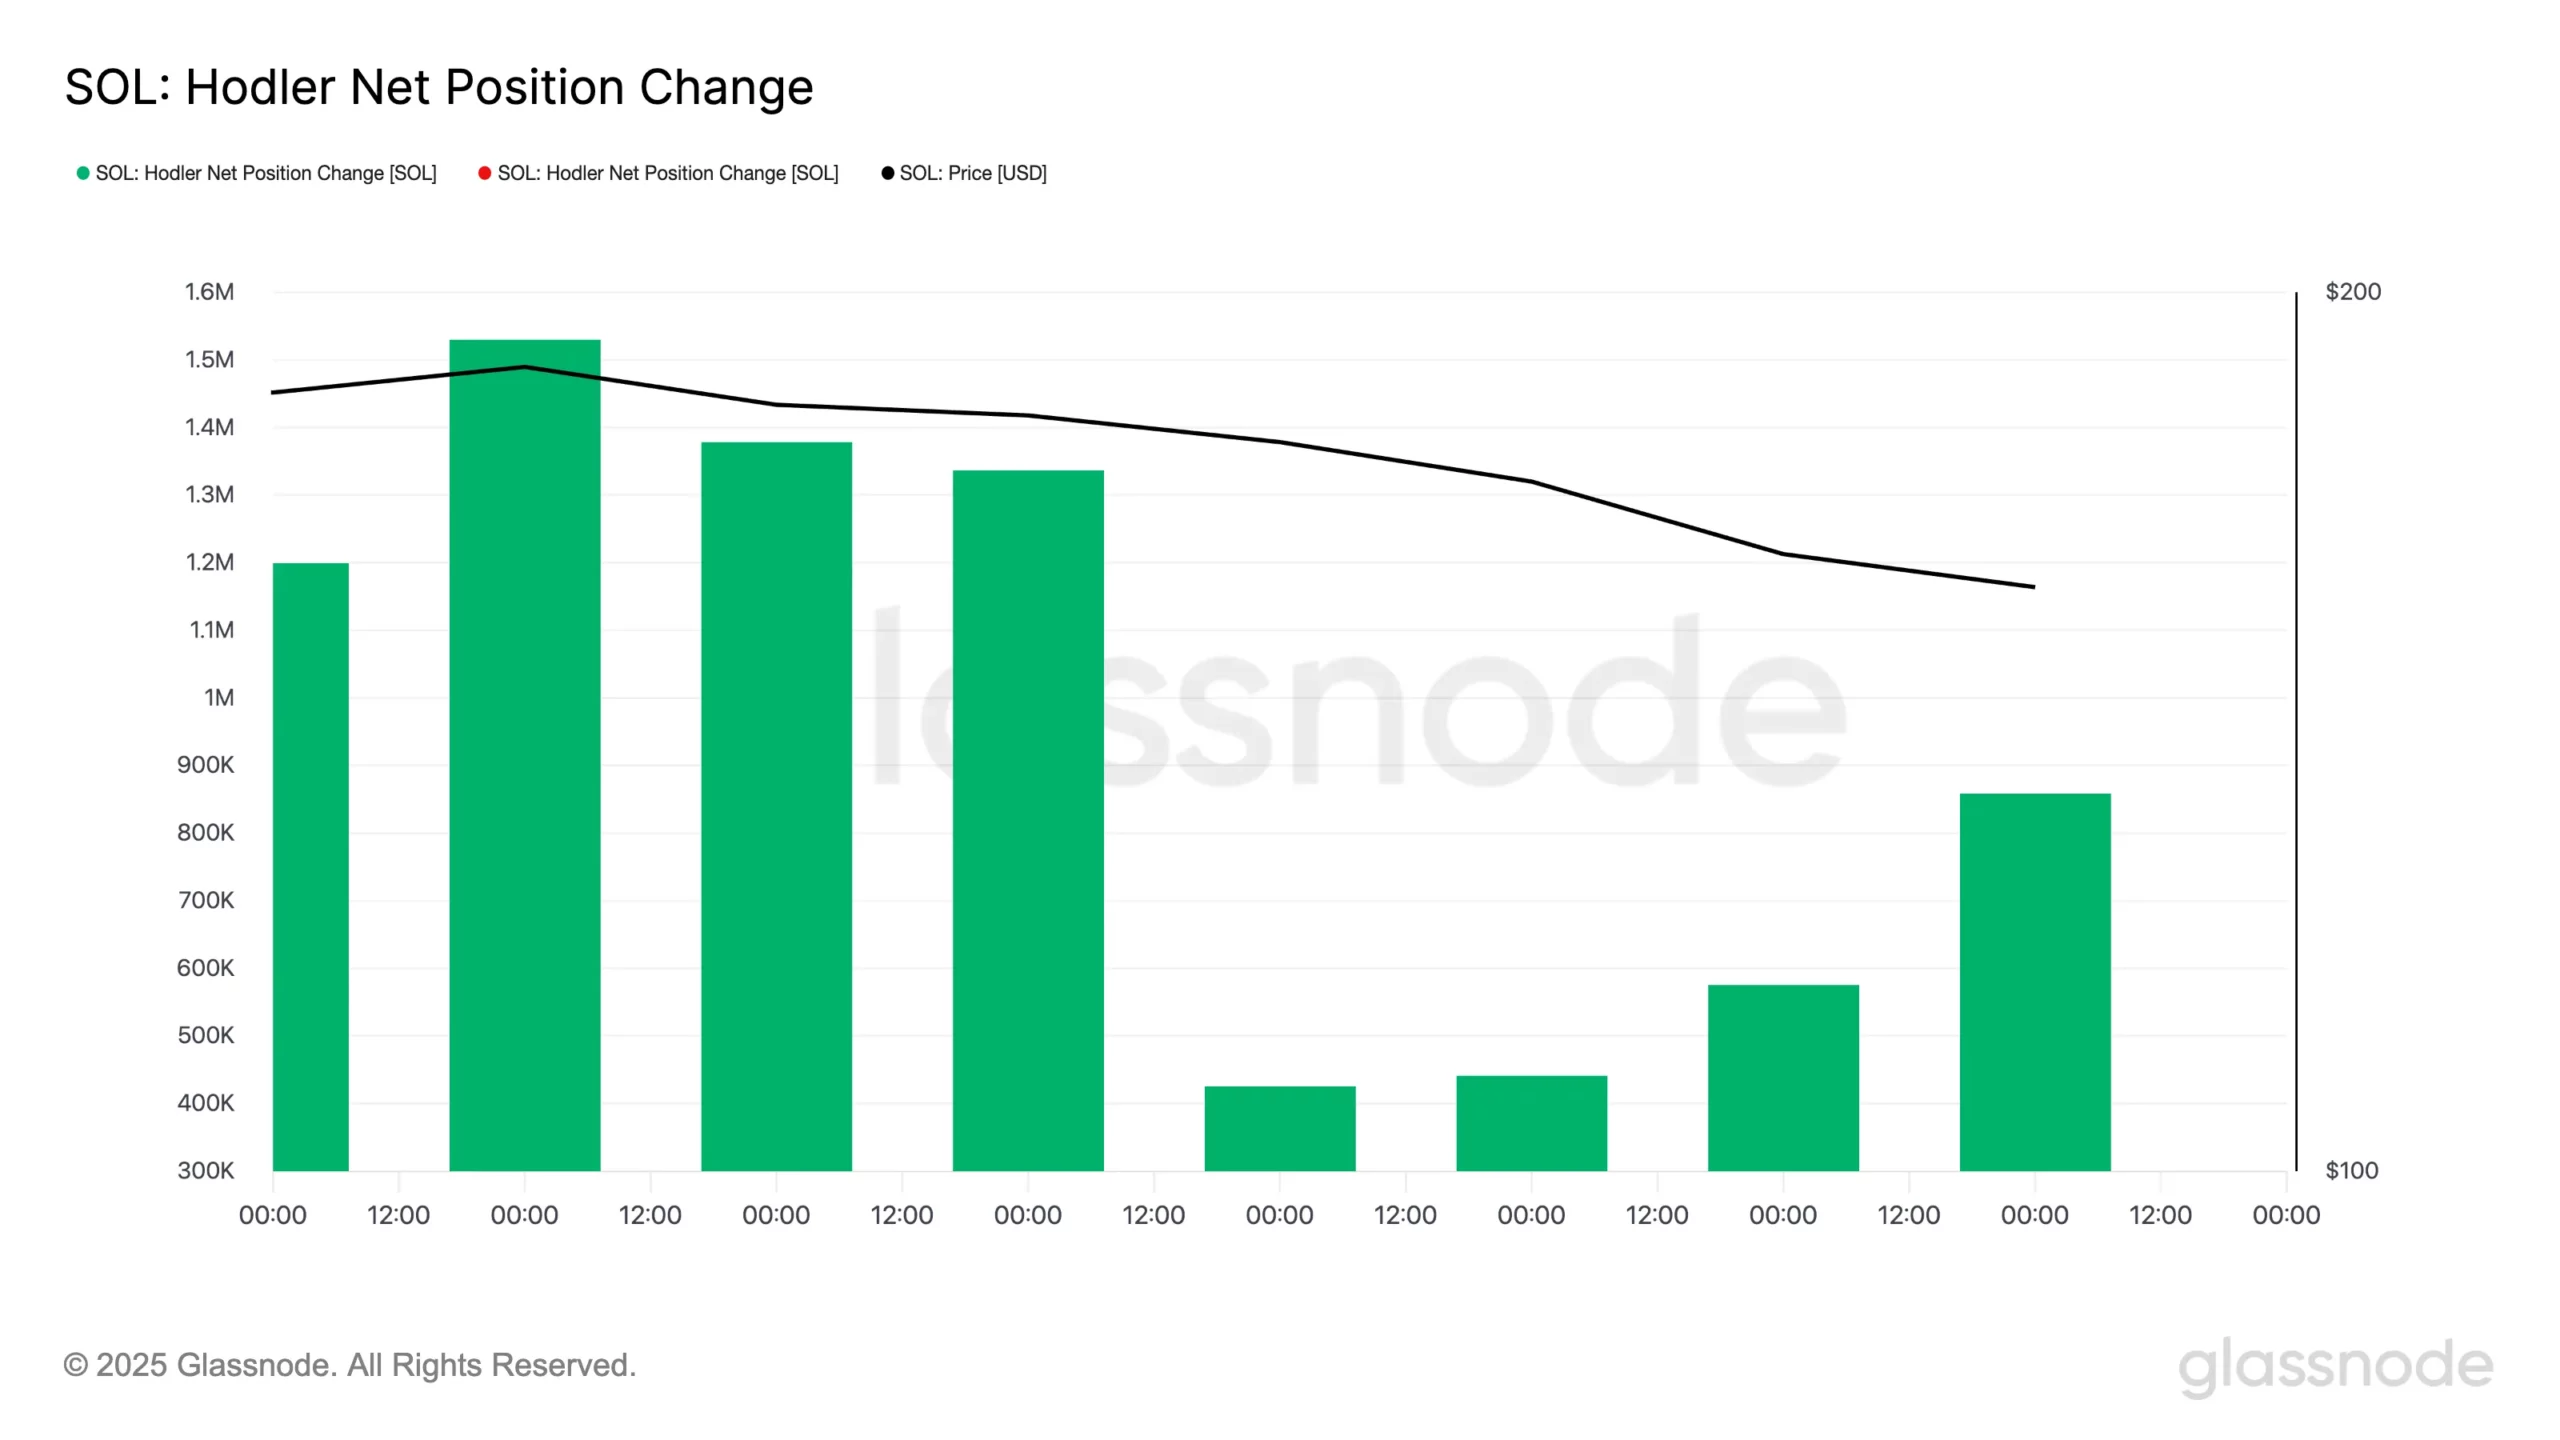
This pattern reflects growing conviction among long-term holders. Increased accumulation often reduces circulating supply, potentially strengthening price support levels over time.
Traders Exit at Losses, Reducing Sell Pressure
Meanwhile, Solana’s Realized Profit/Loss Ratio fell to a 30-day low of 0.15 on August 2, according to Glassnode. This metric measures whether traders are selling at a profit or loss. A ratio below 1 indicates that most sellers are exiting at a loss.
When traders sell below their cost basis, markets often stabilize as fewer holders remain willing to sell at depressed prices. This trend aligns with the ongoing accumulation by LTHs and suggests selling pressure is easing.
With declining sell-offs, increased long-term accumulation, and reduced realized profits, Solana appears to be forming a local bottom. These on-chain signals highlight a shift toward stronger holder confidence despite the asset’s recent lack of momentum.
Solana Forms Bullish Flag Pattern on August 3 Chart
This SolanaSOL/USDT chart, created on August 3, 2025, shows a clear bullish flag pattern. A bullish flag pattern is a continuation pattern that forms after a strong price rally, followed by a brief consolidation in a downward-sloping channel, before an expected breakout to the upside.
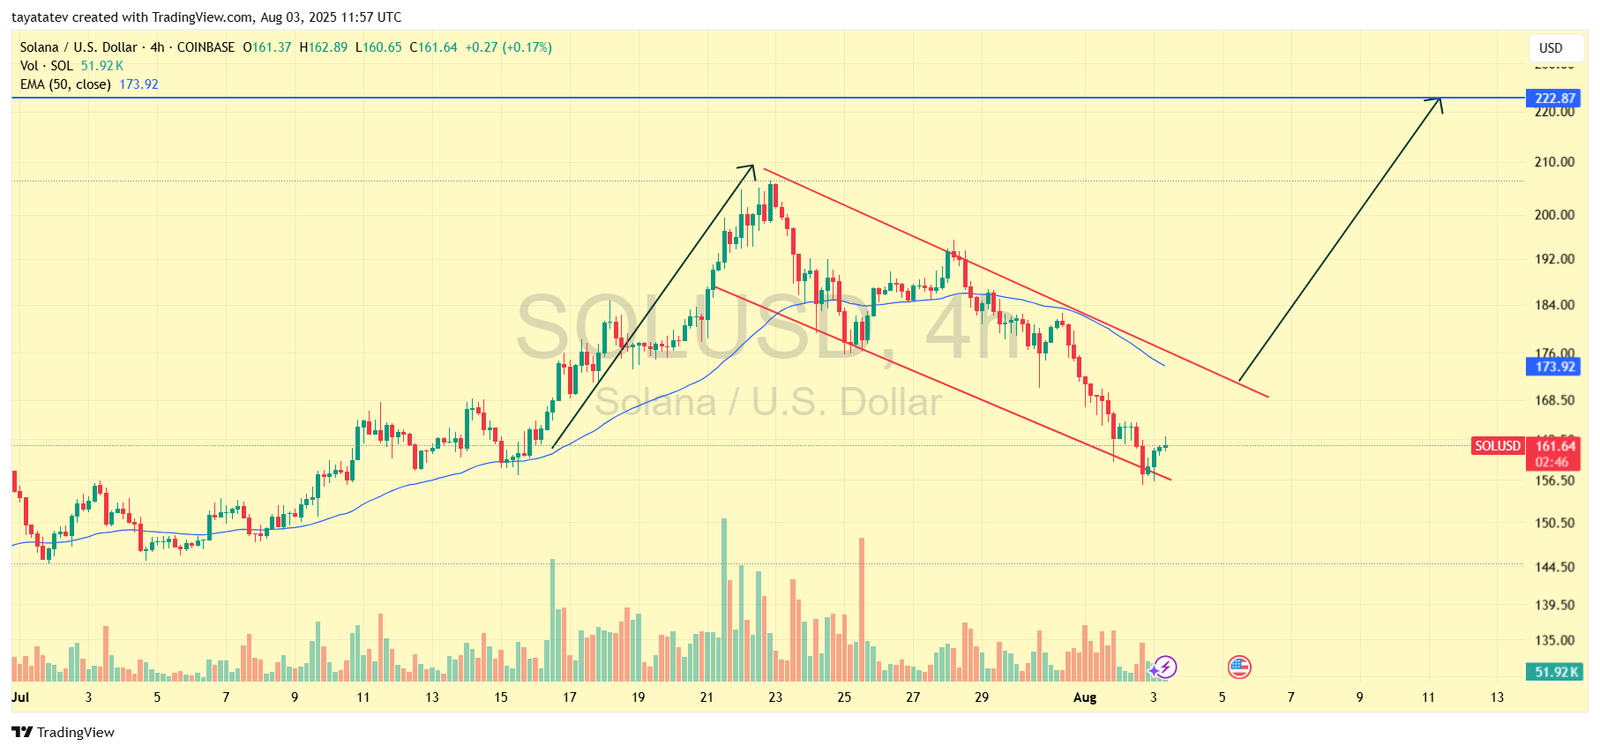
The chart highlights how Solana surged sharply before entering a downward channel marked by parallel red lines. This consolidation phase has developed while the price remains above a key trendline, indicating temporary selling pressure after a strong upward move.
If this bullish flag pattern confirms, it signals that Solana’s price could rise 38 percent from its current level of $161.64, potentially reaching $222.87. The presence of this setup aligns with typical price behavior, where consolidation phases within such patterns precede significant upward extensions.
The 50-period Exponential Moving Average (EMA), currently at $173.92, also acts as an important dynamic resistance level. A breakout above this EMA would further validate bullish momentum and strengthen the probability of an upward move toward the projected target. The volume data supports this outlook as it shows declining activity during consolidation, which often precedes a breakout surge.
The pattern’s structure and alignment with on-chain accumulation trends suggest improving sentiment among long-term holders. With Solana consolidating within this range and its EMA positioned nearby, the technical setup supports a potential breakout that could restore its prior bullish trajectory.
Solana MACD Indicator Shows Potential Bullish Shift
This Moving Average Convergence Divergence (MACD) chart for Solana (SOL), created on August 3, 2025, highlights a possible shift in momentum. The MACD indicator measures the relationship between two moving averages of an asset’s price to identify potential trend reversals or continuations.
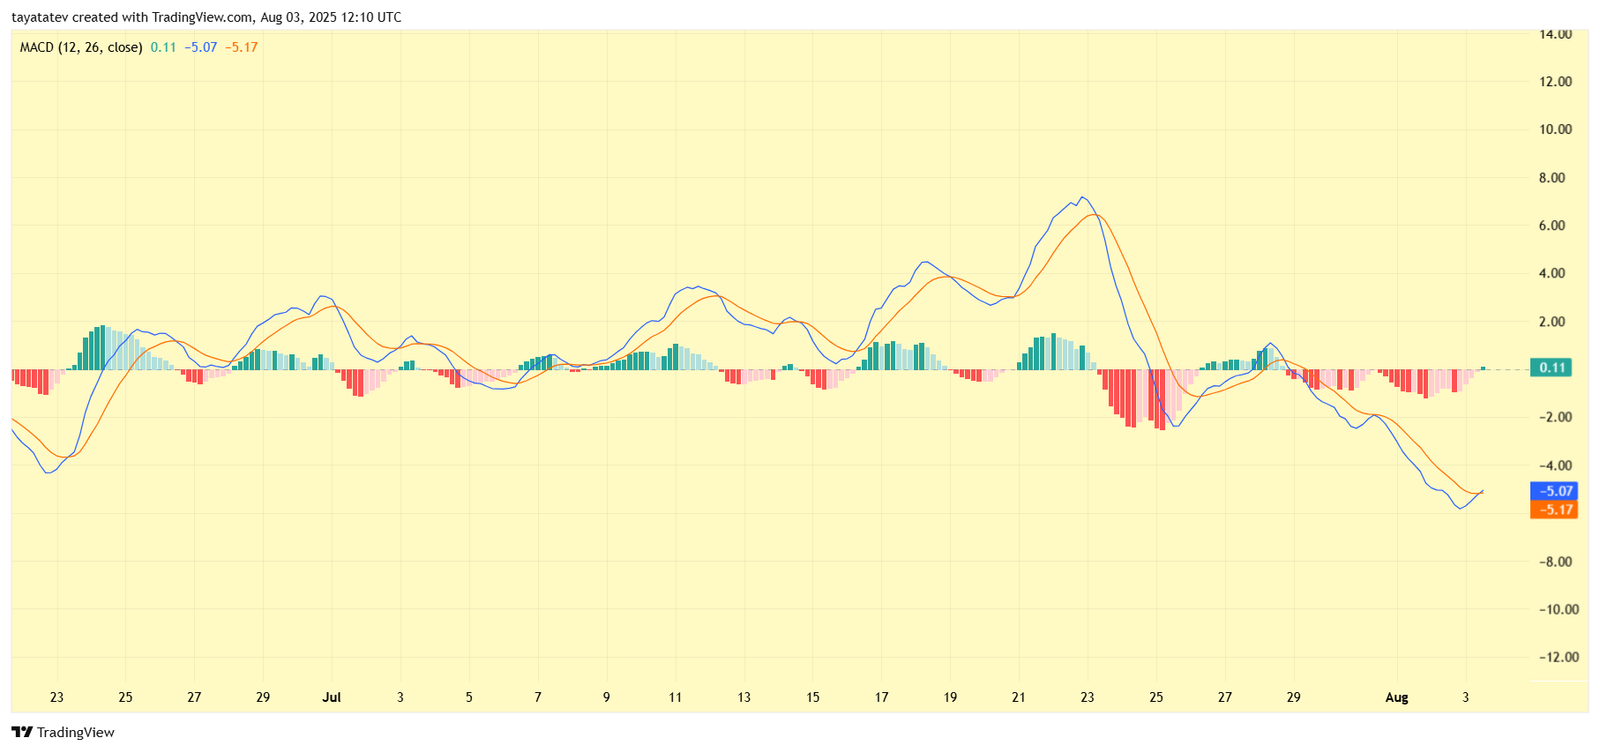
Currently, the MACD line (blue) is positioned just below the signal line (orange) at -5.07 versus -5.17, while the histogram has turned slightly positive at 0.11. This crossover, if confirmed, signals that downward momentum is weakening and buying pressure may be returning.
The histogram’s move into positive territory indicates that the bearish phase is losing strength. This aligns with the recent price action, where Solana stabilized near $161.64 and began forming a bullish flag pattern. A confirmed MACD crossover above the signal line would reinforce the case for a potential breakout, supporting an upward move toward the projected target of $222.87.
The alignment of a weakening bearish MACD trend with the bullish flag formation strengthens the technical outlook for Solana. If momentum continues to build, it could mark the early stages of a trend reversal in favor of buyers.
Solana RSI Indicates Oversold Conditions
This Relative Strength Index (RSI) chart for Solana (SOL), created on August 3, 2025, shows that the RSI has dropped to 31.82, near the oversold threshold of 30. The RSI is a momentum indicator that measures the speed and change of price movements, helping identify overbought or oversold conditions in an asset.
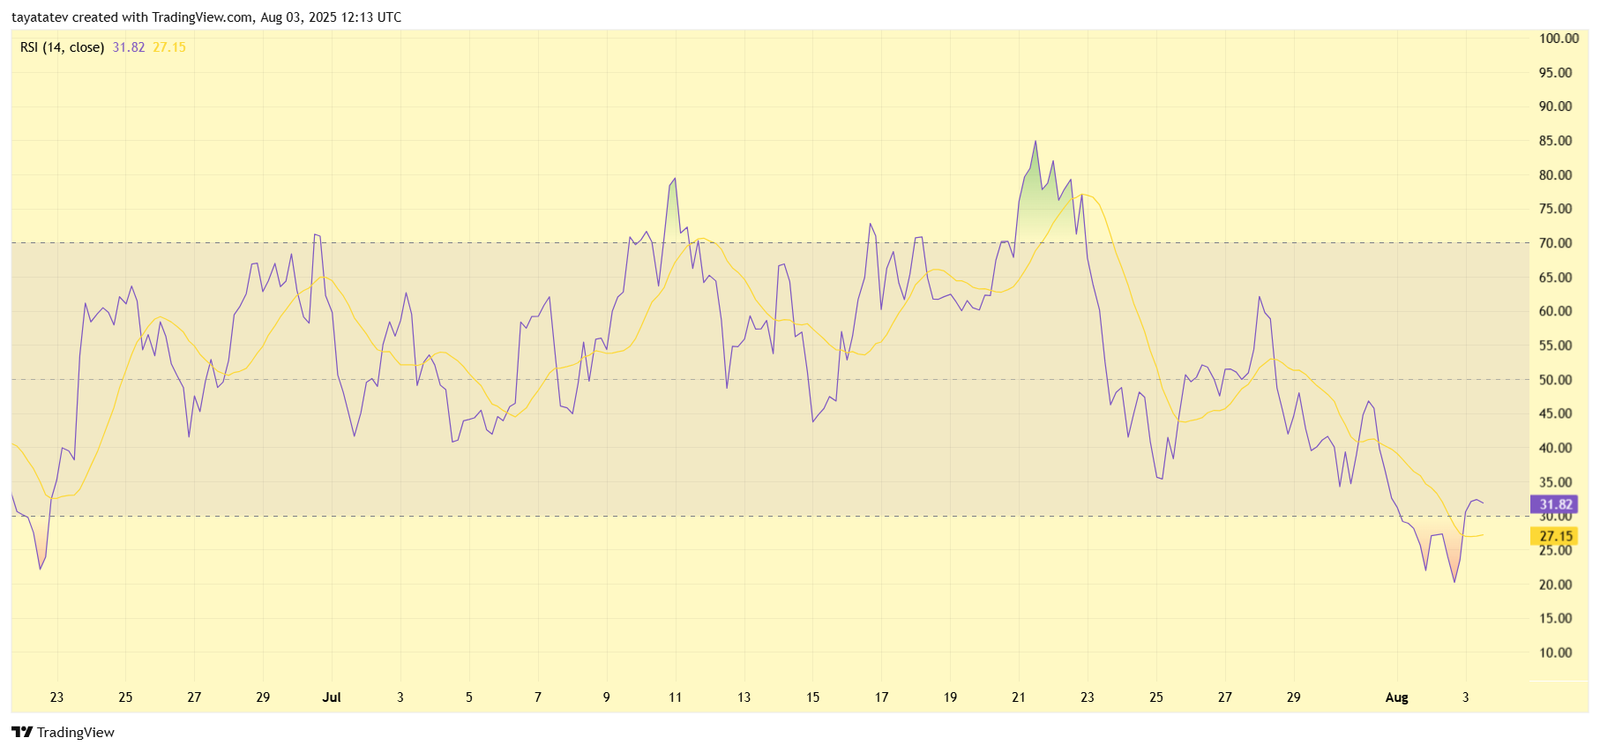
Currently, SOL’s RSI hovering near oversold territory suggests that selling pressure has been strong but may be losing steam. The recent dip below 30, followed by a slight recovery to 31.82, signals that buyers are beginning to re-enter the market after a period of heavy selling. This aligns with the price stabilizing near $161.64 and reinforces the potential for a near-term rebound.
Additionally, the RSI’s gradual upward shift from oversold levels often precedes price reversals, especially when combined with supporting technical patterns. The convergence of this RSI signal with Solana’s bullish flag pattern and improving MACD indicator strengthens the likelihood of a recovery. If RSI continues rising above 40, it would confirm a shift in momentum toward bullish control, adding weight to the projected move toward $222.87.
The RSI’s oversold reading therefore supports the technical case for reduced downside risk and an increased probability of upward price action.
