
On September 3, 2025, analyst Ali suggested that Solana (SOL) could briefly fall to $206 before mounting a recovery toward $217. The chart shared in his update shows SOL consolidating after recent volatility, with price action forming a pattern that hints at both short-term weakness and medium-term strength.
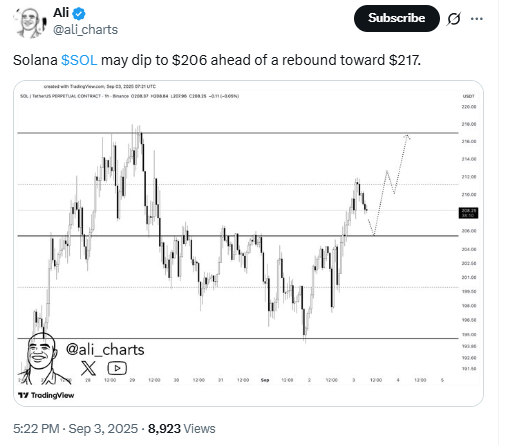
The projected move highlights a potential retest of support at $206. This level has acted as a pivot in recent sessions, making it a likely area where buyers could step in again. Once tested, the analysis indicates that momentum may shift upward, targeting resistance around $217.
This forecast comes as Solana continues to experience strong trading volumes across exchanges, reinforcing its position among leading altcoins. If the rebound materializes as outlined, it would suggest that SOL remains supported by both technical levels and market participation. However, failure to hold above $206 could delay the recovery and expose lower price ranges.
Solana Creates Rising Wedge With 73% Breakout Target
On September 3, 2025, Solana Sol/USD Coinbase chart shows the token trading near $211.64 with the 50-period EMA at $203.08 while price action has created a rising wedge pattern, a formation where price consolidates between two upward-sloping trendlines that converge and often warn of slowing momentum, though in some cases it can lead to a strong continuation if broken to the upside. In this setup, the wedge resistance runs just under the $220–$221 range, while the support line has advanced steadily since late July, reflecting persistent higher lows. Volume currently stands at 233,100, a level that demonstrates steady market engagement without signaling exhaustion, and the EMA’s slope continues to confirm that the short-term trend remains upward.
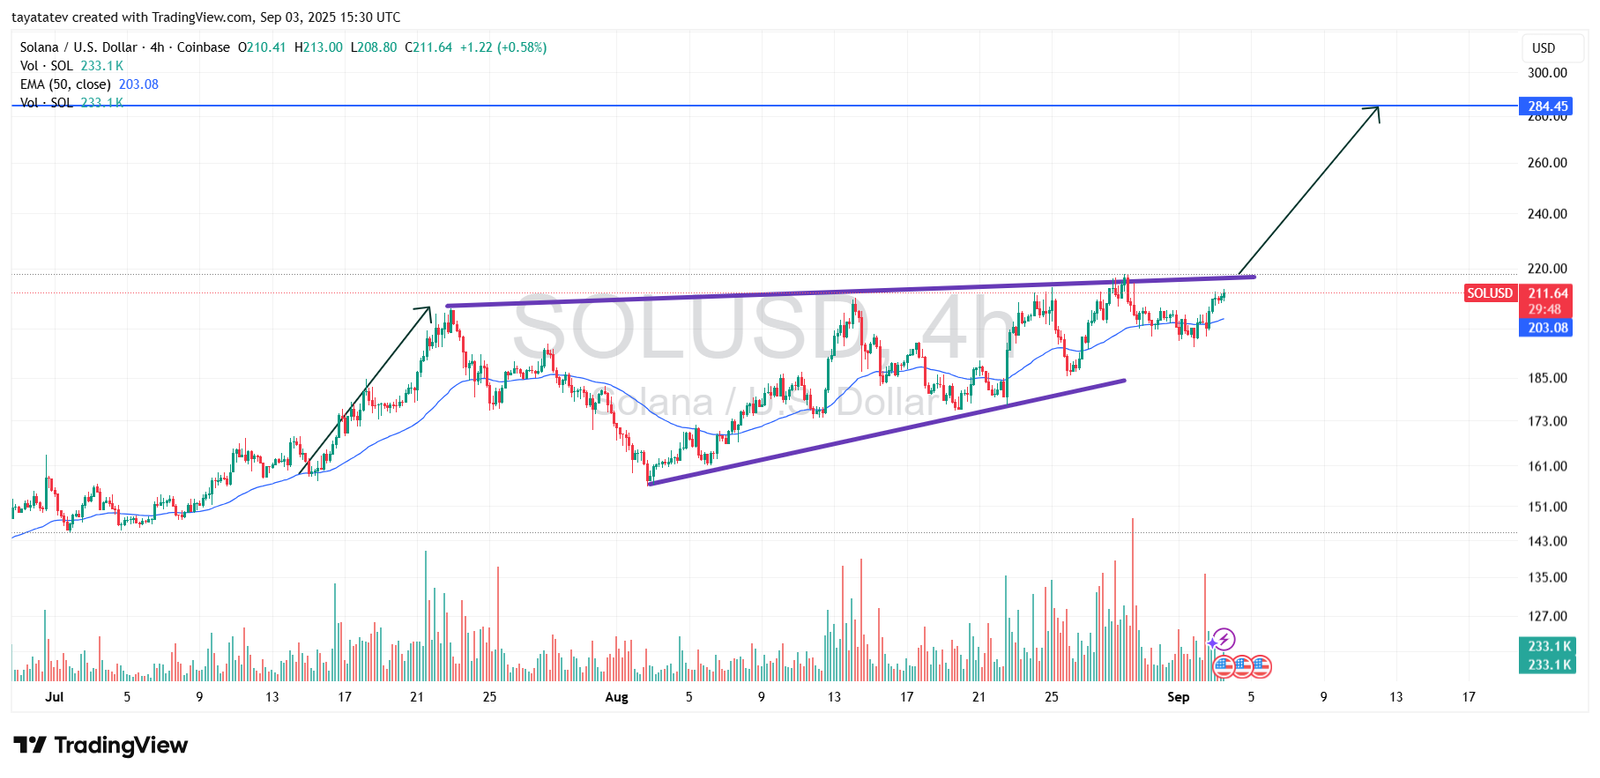
If Solana breaks above the wedge’s upper boundary with rising volume, the breakout would confirm. The measured move projects a 73 percent gain from $211.64, targeting around $366.14. Before that, price will likely face resistance near $284.45, a zone tied to past congestion. Until confirmation, the wedge keeps risk controlled. A rejection near $220 or a drop below wedge support and the EMA could stall momentum and force further consolidation.
Steady volume, a rising EMA, and the clear wedge structure point to a market preparing for a decisive move. Rising wedges often lean bearish, yet context here shows strength. Higher lows continue to form, and buyers remain active above the EMA. The reaction at the $220 level will be key. If confirmed, Solana could begin its path toward the $366.14 breakout target.
Solana MACD Turns Positive as Momentum Rebuilds
On September 3, 2025, Solana’s four-hour chart displayed a significant change in the MACD (12, 26, close), with the histogram shifting back into positive territory at 1.25. The MACD line, plotted in blue at 1.84, has begun to cross above the signal line, shown in orange at 0.59, after an extended period of negative readings. This early bullish crossover suggests that bearish pressure is easing and buying momentum is starting to return.
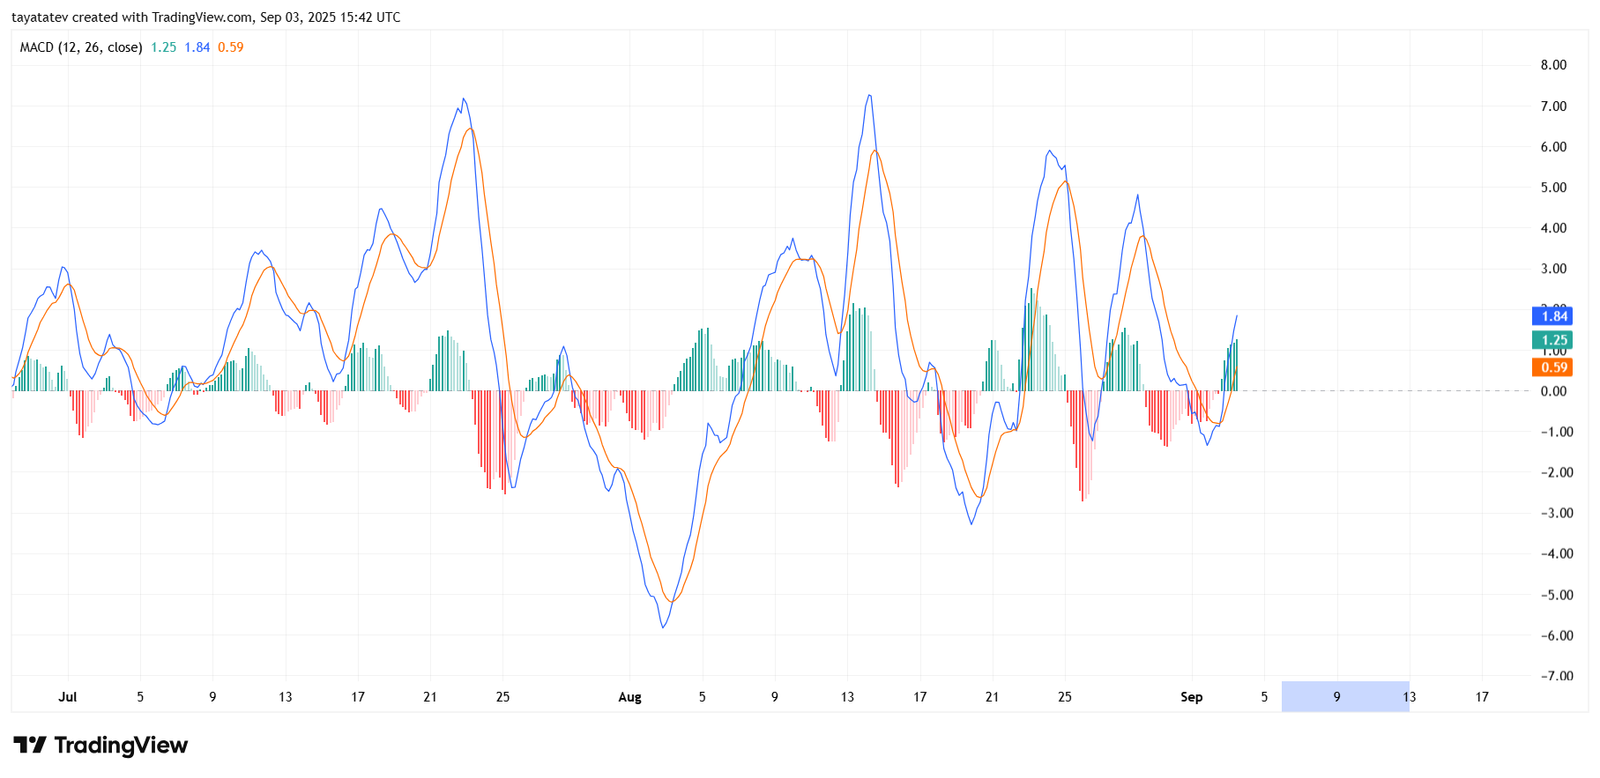
The MACD, which measures the distance between two moving averages, highlights shifts in momentum strength. When the MACD line rises above the signal line with the histogram turning green, it signals that trend direction is favoring buyers. For Solana, this crossover follows several weeks of alternating red and green histograms, reflecting volatile trading within a rising wedge. The latest move toward the positive side suggests that accumulation is building in line with the wedge breakout scenario identified on the price chart.
Importantly, this recovery comes as Solana continues to test resistance around $220, the upper boundary of its wedge formation. If MACD momentum continues to expand while the histogram prints longer green bars, it will provide strong confirmation that the breakout is gaining traction. Conversely, if momentum stalls and the crossover fails, price could remain trapped in consolidation. For now, however, the combination of a positive MACD shift, steady histogram growth, and a recovering short-term trend points to improving conditions that align with the projected upside toward higher targets.
Solana RSI Points to Building Momentum Above Neutral
On September 3, 2025, Solana’s four-hour chart highlighted the Relative Strength Index (RSI) at 63.41, with its moving average at 52.21. The RSI has climbed back above the neutral 50 level after weeks of oscillation between support near 30 and resistance near 70. This return to strength suggests that buyers are gradually regaining control and that momentum is shifting in favor of accumulation rather than distribution.
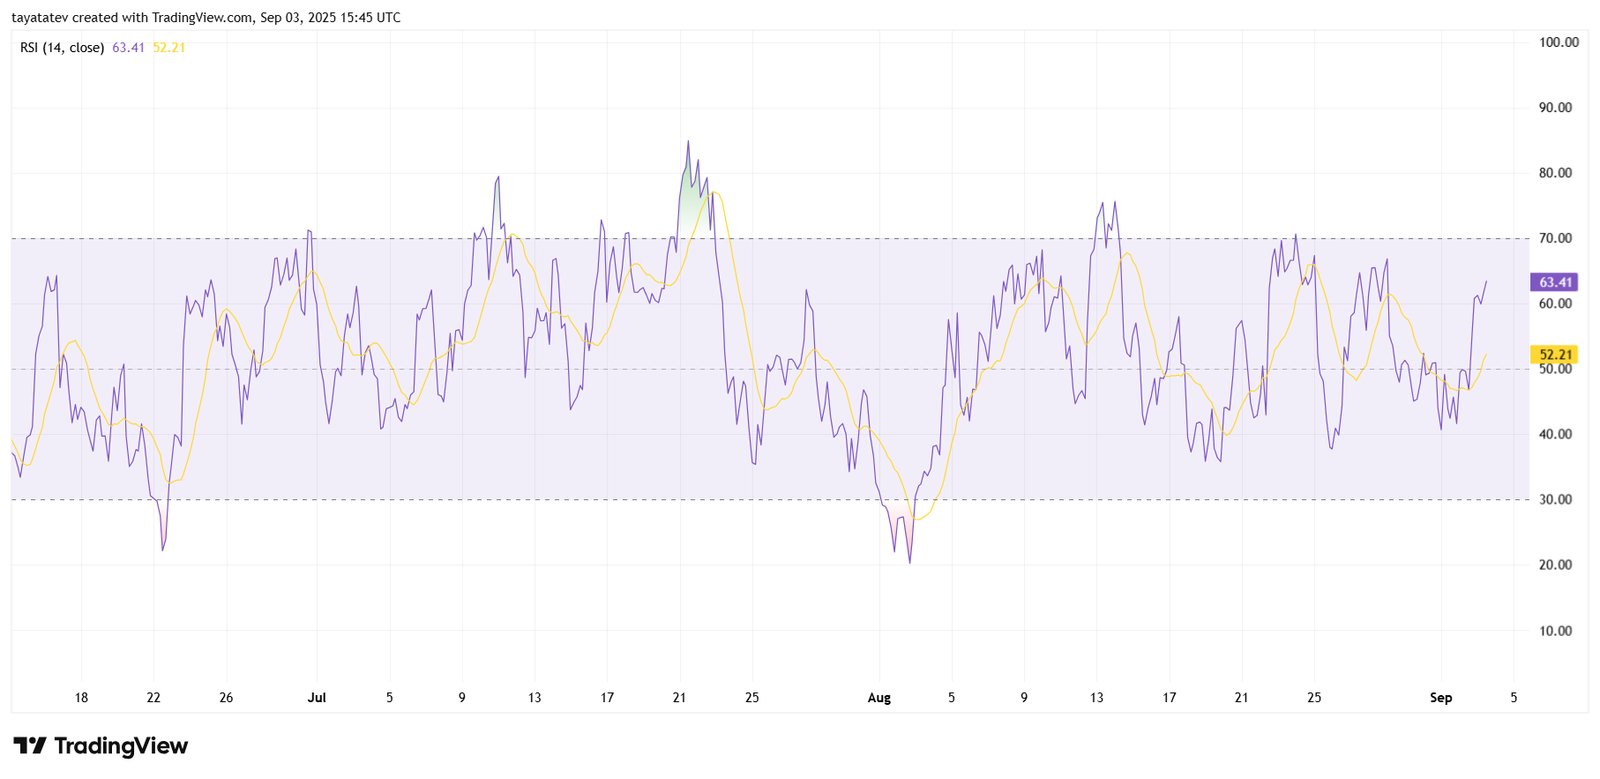
The RSI, which measures the speed and magnitude of recent price movements, often signals when an asset is overbought or oversold. In this case, the steady rise toward the 60–70 zone implies that Solana is approaching stronger bullish momentum without yet reaching overheated conditions. Importantly, the purple RSI line crossing above its yellow moving average reinforces this signal, indicating that the latest leg of buying pressure is strong enough to tilt the short-term trend upward.
This reading aligns with the broader technical context of Solana trading inside a rising wedge. Momentum indicators such as the RSI add weight to the possibility of an upside breakout, particularly as price tests the wedge resistance around $220. If the RSI continues climbing toward 70, it would confirm strengthening momentum behind the wedge structure, supporting the scenario of a breakout rally projected to extend significantly higher. Conversely, a failure to hold above 50 could indicate that Solana remains rangebound. For now, however, the RSI’s positioning clearly favors bulls as the token prepares for a decisive test of resistance.
