
Brera Holdings will rebrand as “Solmate” and run a Solana-based digital-asset treasury after a $300 million private placement. The backers include the Solana Foundation, ARK Invest, Pulsar Group, and RockawayX. The company says it will accumulate and stake SOL while keeping its soccer operations.
Brera announced the plan on Sept. 18. Its materials describe a dual-listing push in the UAE and a focus on building Solana infrastructure. Cantor Fitzgerald advised the deal.
Coverage notes ARK bought 6.5 million shares linked to the pivot. Reports also highlight the Solana Foundation’s role among strategic supporters.
$1B Solana treasury initiative lines up capital
Galaxy, Jump, and Multicoin are aligning on a $1 billion Solana treasury vehicle. Reporting indicates the Solana Foundation supports the effort. The raise targeted early September close.
On the same news cycle, other public companies outlined Solana-focused treasury strategies. Disclosures included plans to buy SOL on the open market and, in some cases, directly from the Foundation.
Multicoin’s post framed the thesis as building a leading Solana treasury operator. It placed the move within broader institutional participation on Solana.
Alpenglow and Firedancer enter defined windows
Solana’s governance has cleared the Alpenglow upgrade path. Testnet is scheduled for December 2025 at Breakpoint, with a mainnet target in early 2026, subject to testing. Materials emphasize sub-second finality and consensus changes.
Community explainers say Alpenglow focuses on faster finality and validator economics. They place public testnet in Q4 2025 and mainnet in Q1 2026 if milestones hold.
Firedancer, Jump’s independent validator client, continues phased rollout. Commentary stresses client diversity and resilience first, with performance gains arriving as adoption widens.
Jito schedules token-holder call; Copper adds JitoSOL
Jito Foundation set its first token-holder call for Sept. 24. The agenda covers the last quarter’s work and next steps for the liquid-staking and MEV stack.
Institutional custodian Copper added custody and staking support for JitoSOL this month. The firm said clients can now hold and stake JitoSOL within its network.
Industry coverage describes the integration as expanding institutional access to Solana’s leading LST. It arrives ahead of Jito’s community update next week.
Solana daily chart, Sept. 20, 2025 — rising-wedge breakout, +7% realized, +11% extension points to ~$264 before the $282 area
The chart was created on Sept. 20, shows SOLUSD breaking out above a rising wedge on the daily timeframe, with price near $238 and the 50-day EMA trending higher around $207.91. A rising wedge forms when price prints higher highs and higher lows while two upward-sloping trendlines converge, which indicates tightening momentum inside an uptrend.
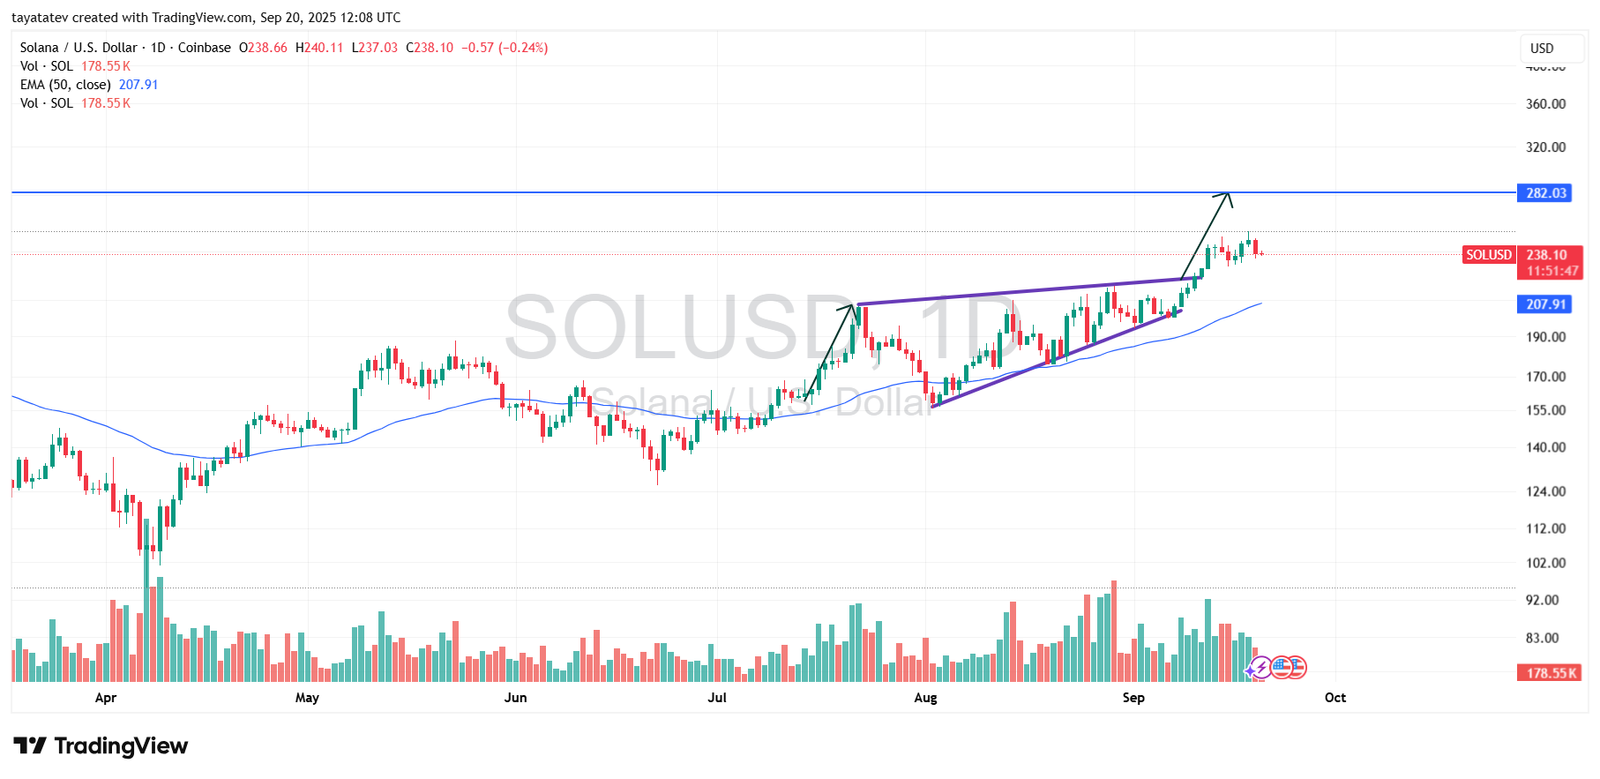
Here, price pushed through the wedge’s upper boundary rather than failing at it, so the breakout confirms control by buyers on this timeframe. After clearing the ceiling, SOL already advanced about 7%, moving from roughly $222.5 at the wedge top to about $238 today. With that leg in place, an additional 11% continuation from current levels would reprice SOL from about $238 to roughly $264, which sits below the thicker resistance band drawn on the chart near $282.03.
The structure still favors follow-through because the breakout arrived after weeks of compressed range, the 50-day EMA slopes upward beneath price, and the first post-breakout pullbacks held above the former wedge line. However, momentum typically cools as price approaches marked supply, so the path reads as $264 first, then the pre-plotted $282 region if bids absorb offers. In validation terms, the prior ceiling near $233 now acts as the first support; losing it would risk a retest toward the rising 50-day EMA around $208, while holding above it keeps the breakout thesis intact.
Solana daily RSI on Sept. 20, 2025 — bullish regime above 50, momentum eases under its average
The chart plots the 14-period RSI in purple at 61.29 with a signal average in yellow at 64.90. The reading sits firmly above 50, which marks a bullish momentum regime on the daily timeframe.
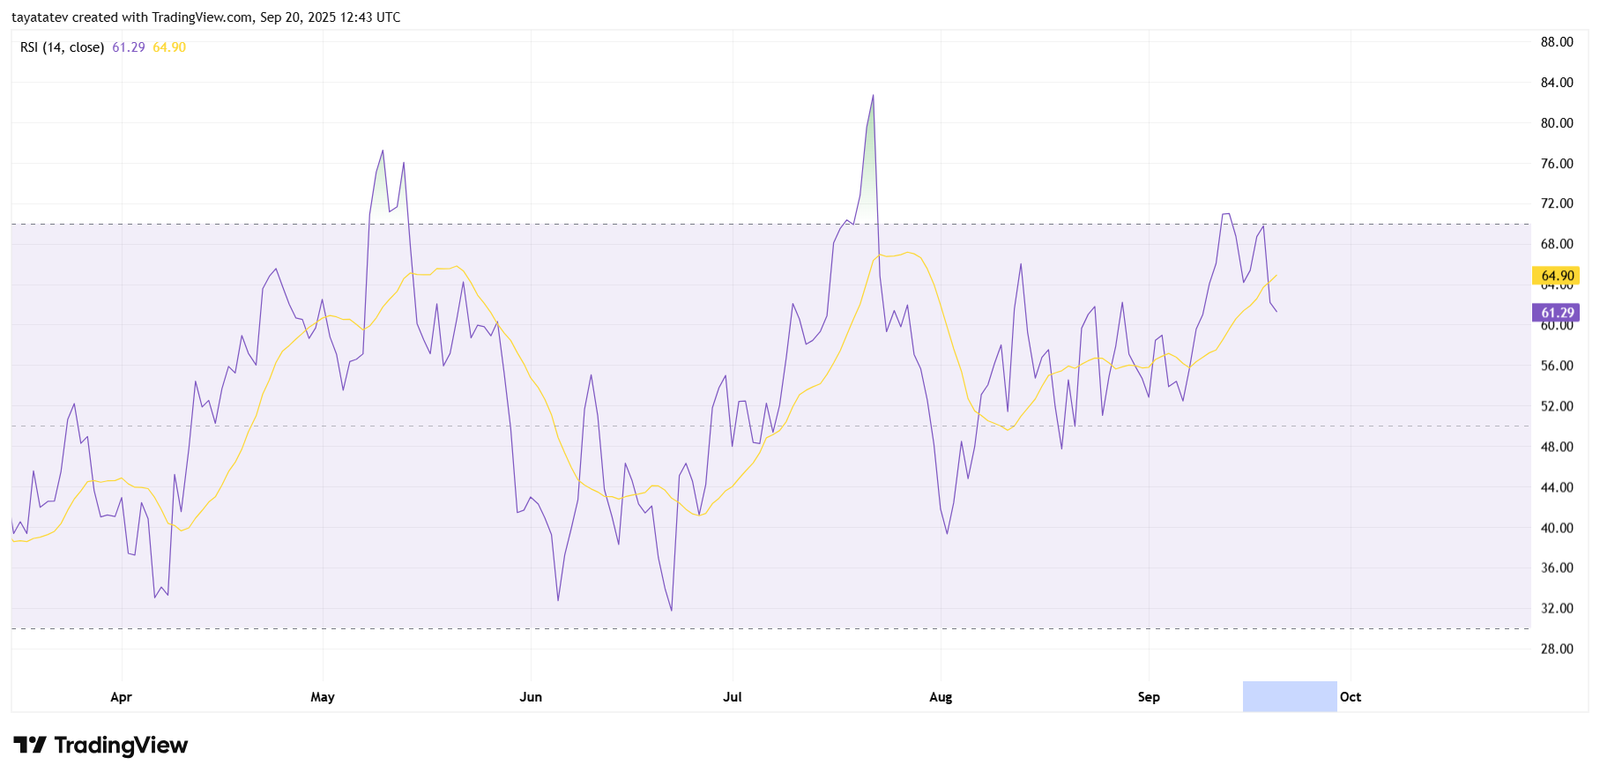
Through September, RSI swung above 70, then cooled, and now holds in the 60–65 band. That placement shows buyers still control trend strength while avoiding an immediate overbought condition. It also indicates enough headroom before the typical 70 line that often triggers profit taking.
However, RSI now runs below its own average, so near-term thrust has softened since the earlier spike. That relationship often precedes short pauses or shallow pullbacks, especially after a fast advance. Therefore, momentum remains positive, but the slope signals a slower pace than the late-August surge.
What the levels imply for momentum risk and continuation
As long as RSI holds above 50, the bullish regime remains intact on this timeframe. Sustained action in the 55–65 zone tends to favor continuation after consolidations, because it reflects persistent demand without exhaustion. The current posture fits that profile.
A decisive push back above the signal average would re-accelerate momentum and reopen a test of the 70–72 area seen earlier this month. That kind of reclaim usually follows brief digestion phases and confirms renewed strength. Until then, the market can consolidate while keeping trend quality.
Conversely, a break under 50 would neutralize momentum and shift focus to a mean-reversion phase rather than continuation. The chart does not show that signal today. Instead, it shows stabilization above 60 with a modest negative gap to the average, which argues for patience while the indicator resets within an overall constructive setup.
Solana daily MACD on Sept. 20, 2025 — bullish alignment above zero with momentum easing
The MACD chart was created on Sept. 20. The MACD line reads 12.05, the signal line sits at 11.59, and the histogram shows +0.46. The indicator holds well above the zero line after an early-September cross from negative to positive territory.
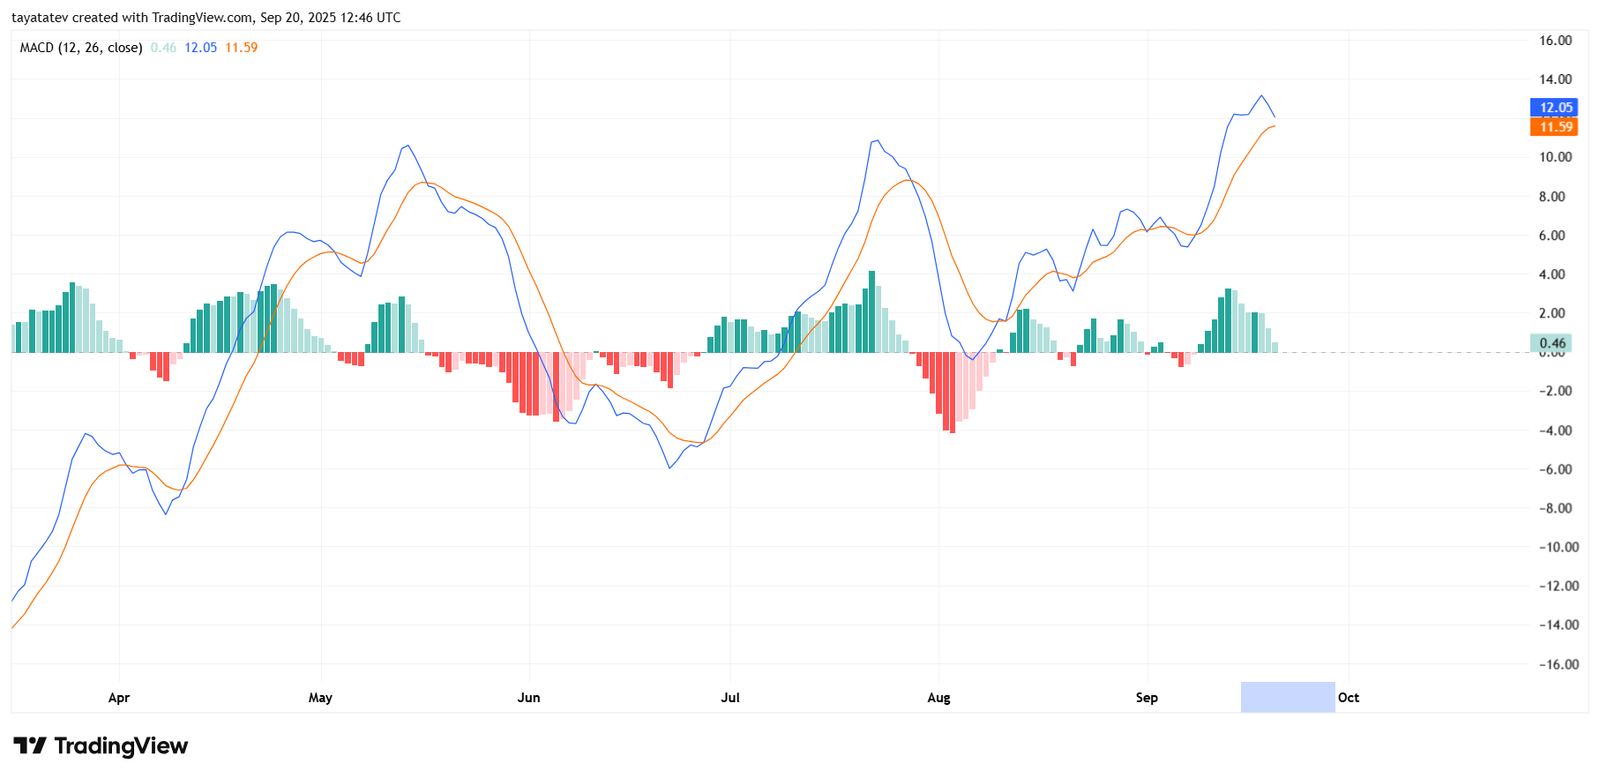
The bullish alignment remains intact because the MACD line stays above the signal line. Price strength earlier in September pushed momentum to a local peak near mid-teens on the MACD scale. Since then, the gap narrowed, so the histogram prints smaller green bars, which signals a slower pace.
Even so, the structure favors continuation while MACD holds above zero. Pullbacks inside positive territory often reset without breaking trend. A renewed widening of the MACD–signal spread would confirm re-acceleration; a close cross back under the signal would instead warn of a pause. Today’s reading shows constructive momentum with a mild cooldown, not a reversal.
