
Sui continues to draw attention from institutional investors as the U.S. Securities and Exchange Commission reviews the 21Shares spot Sui ETF proposal. If approved, the product would bring the token into the same category as Bitcoin and Ethereum, both of which already have active exchange-traded funds.
The application reflects a broader push to diversify crypto-backed investment vehicles. It underscores the growing demand from both institutional and retail investors for regulated exposure to emerging blockchains. Market observers stress that the decision could determine the pace of Sui’s entry into traditional financial markets.
Ecosystem Adoption Accelerates
At the same time, Sui’s ecosystem is expanding. Payments firm xMoney recently launched a new token on the blockchain, aiming to integrate financial applications with Sui’s infrastructure. The rollout demonstrates the network’s appeal for fintech platforms seeking scalability and efficiency.
However, the development also raised concerns about token dilution, particularly for investors holding xMoney’s older token, UTK. The introduction of a parallel asset has fueled debate on how legacy token holders might be affected. Industry analysts noted that this reflects a common tension in blockchain projects, where rapid innovation can sometimes overlap with existing instruments.
Broader Implications for Blockchain Integration
Sui’s growth comes amid heightened competition among layer-1 blockchains aiming to capture institutional and retail adoption. Its position in the ETF review process, alongside ecosystem expansion efforts, places the project in a spotlight at the intersection of decentralized finance and traditional capital markets.
Observers argue that the combination of regulatory milestones and corporate partnerships will shape Sui’s trajectory. While regulatory clarity remains pending, ecosystem developments such as the xMoney launch illustrate the blockchain’s potential to host applications that bridge digital assets with mainstream finance.
Sui’s Falling Wedge Signals Potential 59% Upside
On September 8, 2025, the SUI/USDT 4-hour chart displayed a falling wedge pattern. A falling wedge occurs when price action creates lower highs and lower lows within downward-sloping, converging trendlines. This structure often signals weakening bearish momentum and the possibility of a bullish breakout.

The chart shows Sui trading inside the wedge for several weeks, gradually compressing into a tighter range. During this phase, the 50-period exponential moving average (EMA), plotted at $3.36, acted as a dynamic indicator of market sentiment. The current price sits slightly above the EMA, suggesting that buyers are regaining control as the wedge approaches its breakout point. Staying above this EMA level strengthens the bullish case.
At the same time, trading volume remains subdued, reflecting hesitation among market participants as the wedge narrows. This low-volume environment is typical before decisive moves, since buyers and sellers often wait for confirmation. A breakout supported by a sharp rise in volume would confirm that demand is overwhelming supply, validating the projected move higher.
If the breakout is confirmed, the technical setup implies a potential 59 percent advance from current levels. The projected target lies near $5.44, marking the completion of the wedge’s measured move. Without sufficient volume, however, the breakout risks fading, which could trap price back inside the pattern and extend consolidation.
Sui RSI Analysis Highlights Building Momentum
On September 8, 2025, the SUI/USDT 4-hour relative strength index (RSI) chart showed readings at 57.86, supported by the RSI moving average at 53.95. The RSI is a momentum oscillator that measures the speed and magnitude of price movements, with levels above 70 typically indicating overbought conditions and below 30 reflecting oversold territory.
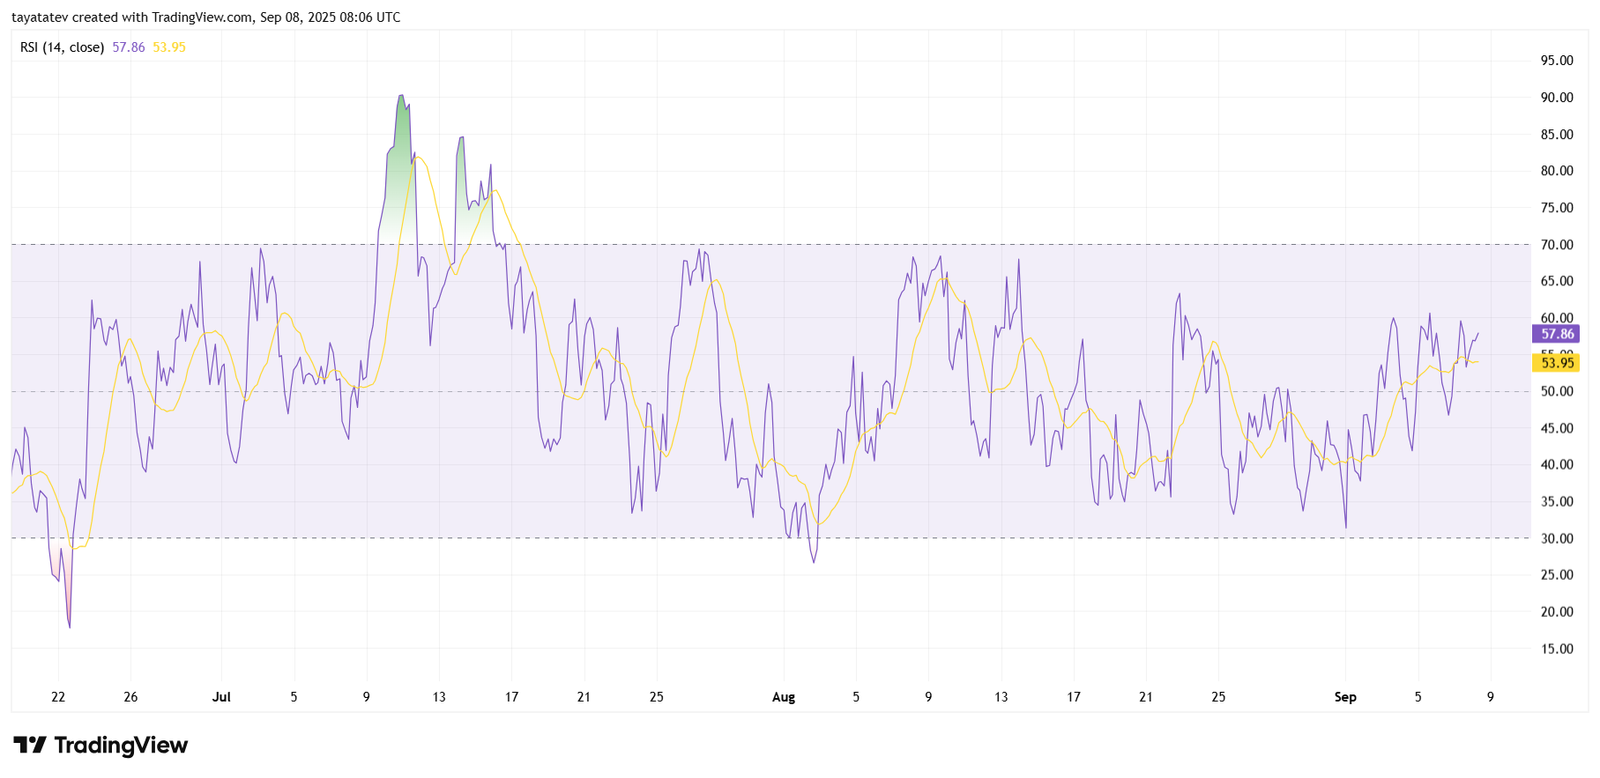
The indicator’s current position just above 50 places Sui in neutral-to-bullish territory. This suggests that momentum is shifting toward buyers, with market sentiment gradually improving. Importantly, the RSI has trended upward from sub-40 levels in recent sessions, marking a recovery phase that reflects increased accumulation. Each prior rebound from similar zones over the past two months has coincided with upward price moves, reinforcing the relevance of the current positioning.
The absence of extreme readings also signals room for expansion. With the RSI below the 70 overbought threshold, Sui retains space for additional upside without facing immediate exhaustion risk. If the oscillator extends toward 60 and beyond, it would confirm stronger bullish momentum. Conversely, a reversal back below 45 would weaken this outlook and point to extended consolidation.
Sui MACD Analysis Signals Growing Bullish Momentum
On September 8, 2025, the SUI/USDT 4-hour MACD (Moving Average Convergence Divergence) chart showed the MACD line at 0.0196 and the signal line at 0.0168, with the histogram printing slightly positive values around 0.0028. The MACD measures the relationship between two moving averages of price, helping identify momentum shifts and trend strength.
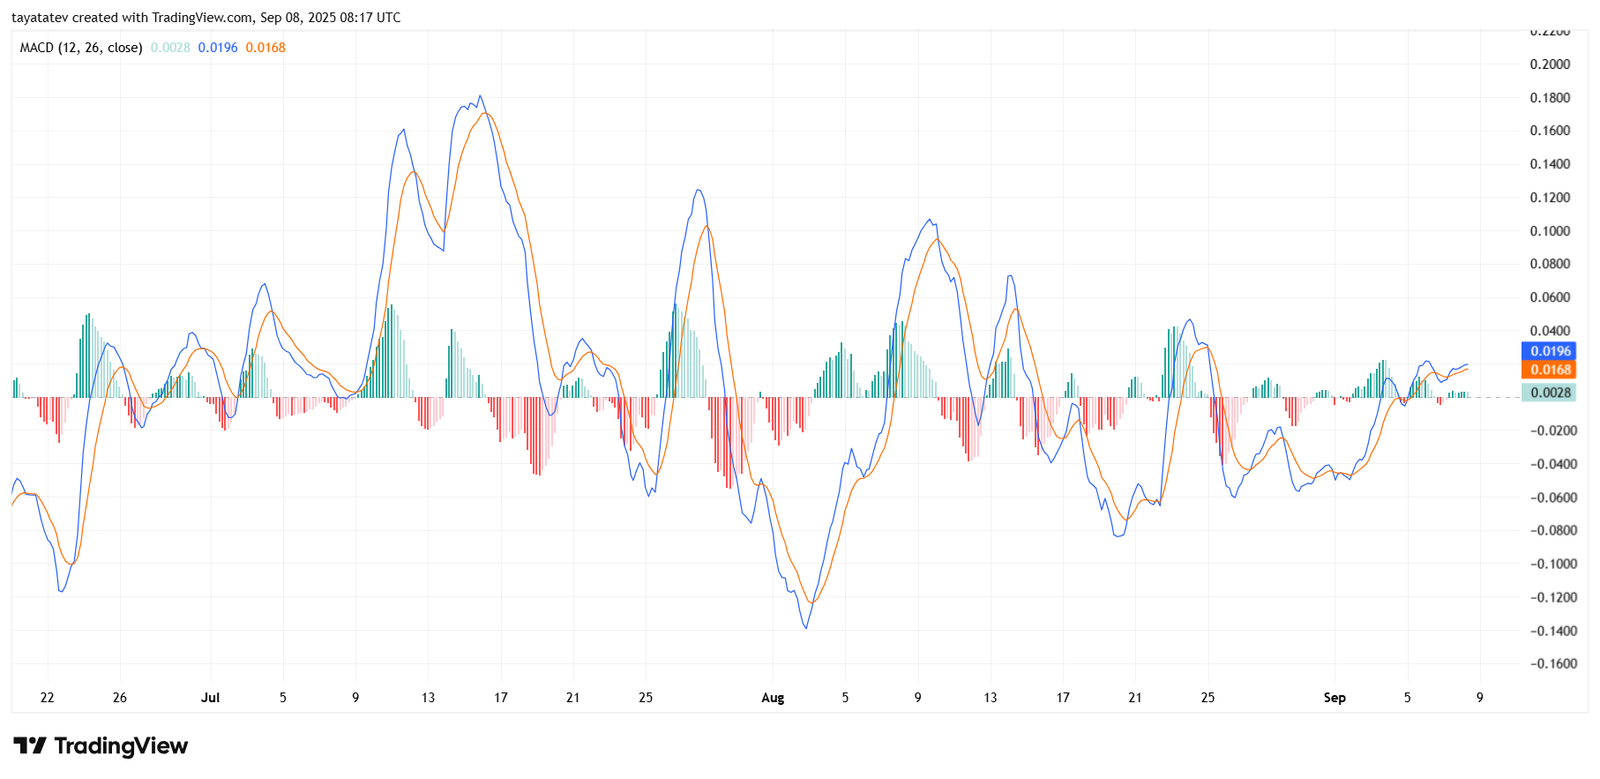
The current crossover, where the MACD line has moved above the signal line, suggests that bullish momentum is building. This shift comes after several weeks of alternating bearish and bullish swings, which were visible through sharp histogram fluctuations. The latest alignment indicates improving sentiment, with the histogram turning green as buyers gain control.
Importantly, the positive crossover is taking place near the zero line, which strengthens the signal. Moves around this neutral zone often carry more weight because they suggest a potential transition from consolidation to a sustained trend. If the MACD line continues to rise above the signal line while the histogram expands, it would confirm accelerating momentum in favor of buyers.
However, the pattern also shows that previous bullish crossovers have been followed by sharp reversals when momentum failed to sustain. This highlights the need for confirmation through continued histogram growth and price follow-through. If the lines converge again without expansion, it would weaken the bullish case and suggest a return to choppy sideways trading.
