
NOIDA (CoinChapter.com) — Bitcoin (BTC) has struggled to sustain upward momentum in May despite briefly nearing the $98,000 mark earlier in May. The world’s leading cryptocurrency is now up just 1.2% year-to-date, hovering near the $94,000–$95,000 zone as of May 6. Meanwhile, Sui (SUI), the Layer-1 blockchain backed by Mysten Labs, has underperformed sharply with a near 20% YTD decline, currently trading near $1.07 after hitting a high of $2.19 earlier this year.
At first glance, the trend seems clear: Bitcoin remains dominant while altcoins lag. But under the surface, momentum may be shifting.
Recent indicators hint at weakening BTC support from U.S.-based whales, highlighted by a negative Coinbase Premium and declining addresses holding over 1,000 BTC. Simultaneously, Glassnode and CryptoQuant data show sluggish Bitcoin network activity despite elevated prices, suggesting a disconnection between valuation and usage.
In contrast, SUI has flashed a series of early bullish signals, including signs of accumulation, rebounding network participation, and increasing social interest. While it still trades well below its all-time highs, technical and on-chain cues imply a potential reversal is brewing.
With macro volatility lingering amid global rate-cut expectations and renewed U.S.-China trade tensions, the question arises: Could an undervalued altcoin like SUI outpace Bitcoin in the coming months?
SUI Sees Strong On-Chain Revival, Bullish Technicals
Sui’s on-chain fundamentals have sharply improved over the past month, with its DeFi total value locked (TVL) surging over 41% to nearly $1.75 billion. The move pushes SUI into the top 10 blockchains by TVL, ahead of Cardano, Avalanche, and Polygon.
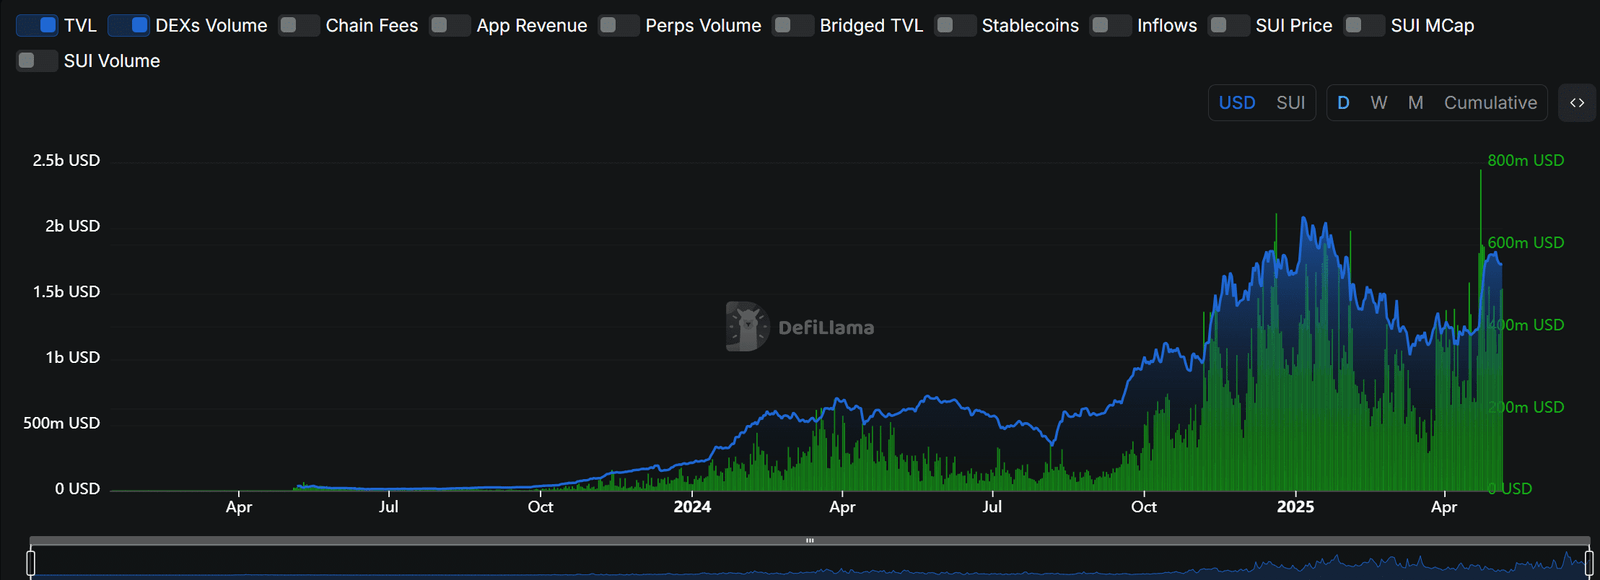
Stablecoin inflows have also jumped, with the circulating stablecoin market cap nearing the $900 million mark, reflecting growing user interaction and liquidity depth across its ecosystem. Decentralized exchange volume crossed $2.9 billion in seven days, led by protocols like Cetus, Momentum, and Bluefin.
Simultaneously, the eight-hour funding rate has flipped positive and continues to rise. This shift shows traders are paying a premium on perpetual contracts, expecting price upside. Rising DeFi traction, capital inflows, and bullish funding data point to growing confidence in SUI’s recovery potential.
Meanwhile, the SUI USD pair has formed a bullish technical pattern called the falling wedge. Traders typically associate the setup with bullish reversals. Two downward-sloping, converging trendlines form the pattern, reflecting diminishing selling pressure as volatility tightens. While the structure suggests a potential upside breakout, price has not yet closed decisively above the upper resistance line.
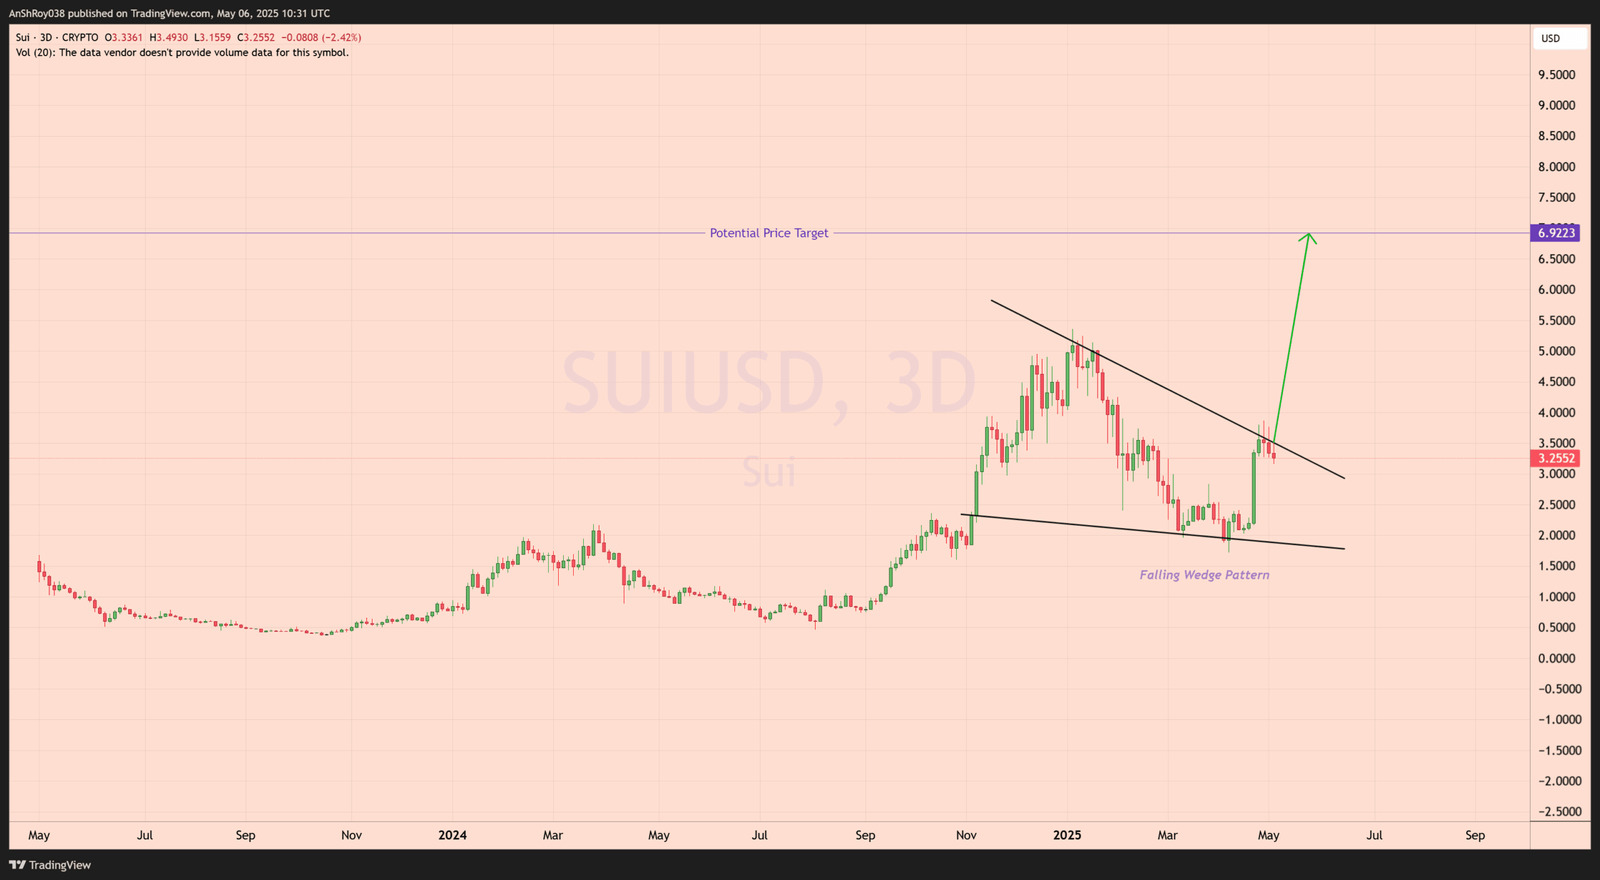
The pattern’s projected target sits near the $6.90 level, calculated by measuring the height of the wedge from its widest point and projecting it above the resistance. However, this remains theoretical until SUI breaks and holds above the wedge’s upper boundary with conviction.
Currently, the token hovers around $3.25 after failing to sustain a push above the descending resistance. This rejection signals caution in the near term. Bulls need a clean break above the upper trendline with strong candle structure to confirm the breakout. Until that happens, the pattern remains unconfirmed, and downside retests within the wedge remain possible.
The wedge structure deserves close monitoring given the positive funding rate and improving on-chain activity. But as of now, the technical breakout is still in waiting—it has not been realized.
Bitcoin Faces Whale Sell Pressure Despite Elevated Price Levels
Bitcoin’s price resilience is near $94,000, which masks clear signs of whale distribution. The latest CryptoQuant data reveals a negative Coinbase Premium, indicating that BTC trades at a discount on U.S.-based Coinbase compared to Binance. Historically, this premium reflects strong institutional buying in the U.S. When it flips negative, it often signals that whales are offloading positions.

This behavior aligns with on-chain data from Glassnode, which shows a stagnation in the number of wallets holding 1,000 BTC or more. After peaking in early 2021, this cohort has declined and remains suppressed even as Bitcoin approaches its all-time highs again.
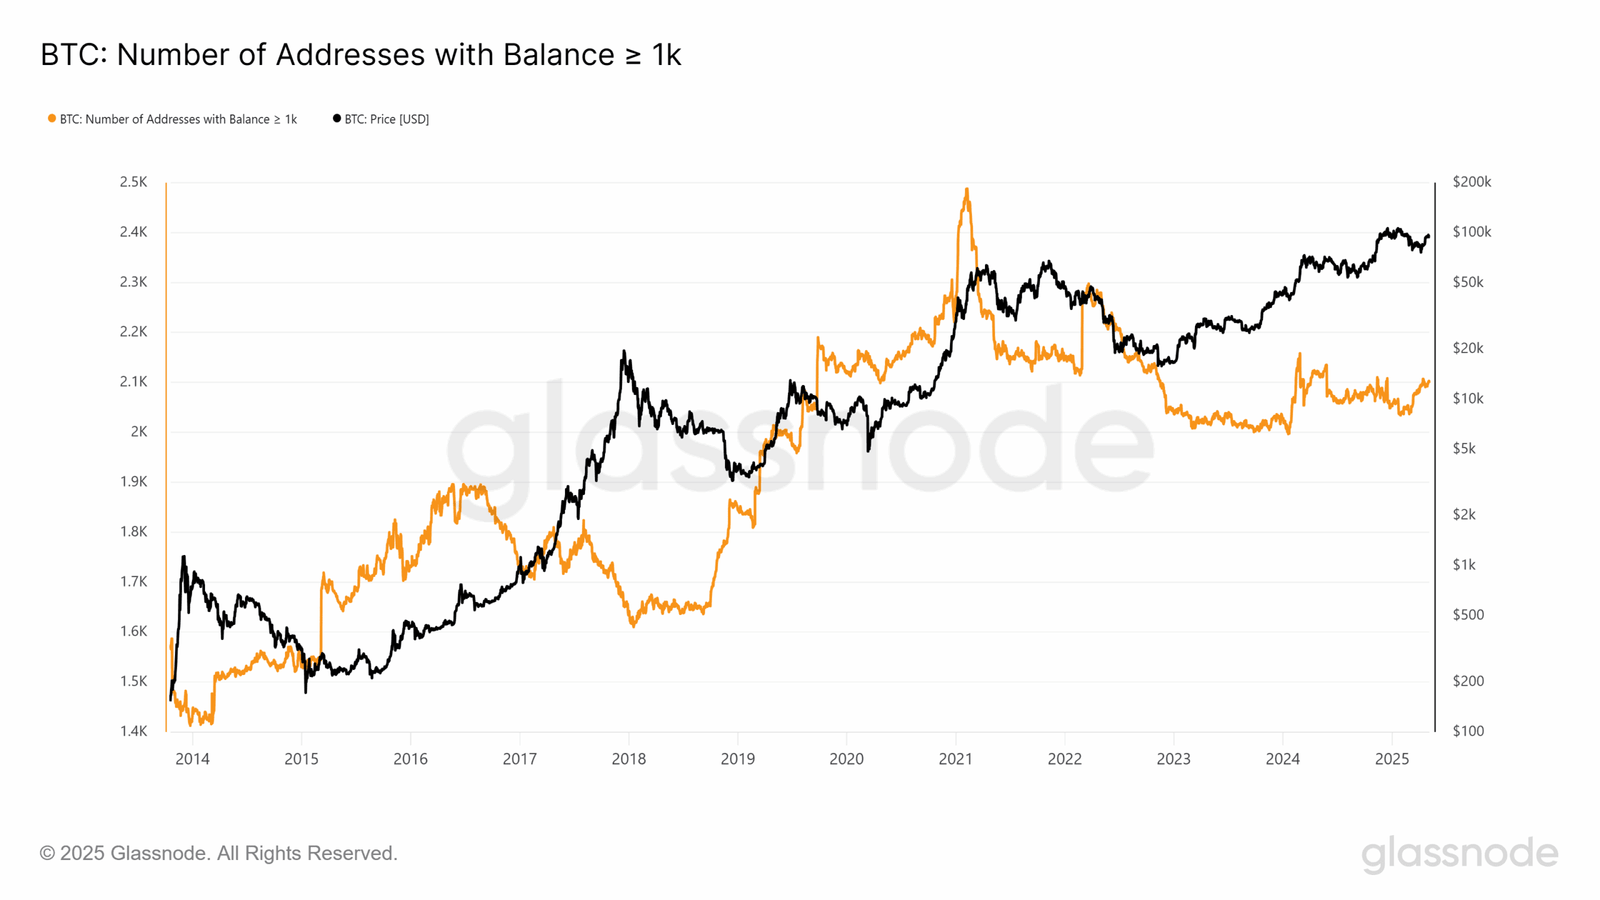
Whales accumulated aggressively during the 2019–2021 cycle, helping fuel a broad rally. In contrast, the current structure shows price moving higher without a corresponding increase in large wallet holdings—an unusual and potentially bearish divergence.
Such a trend indicates that large holders use current high prices as exit points rather than accumulation zones. This divergence between rising prices and falling whale presence highlights weakening conviction among long-term investors.
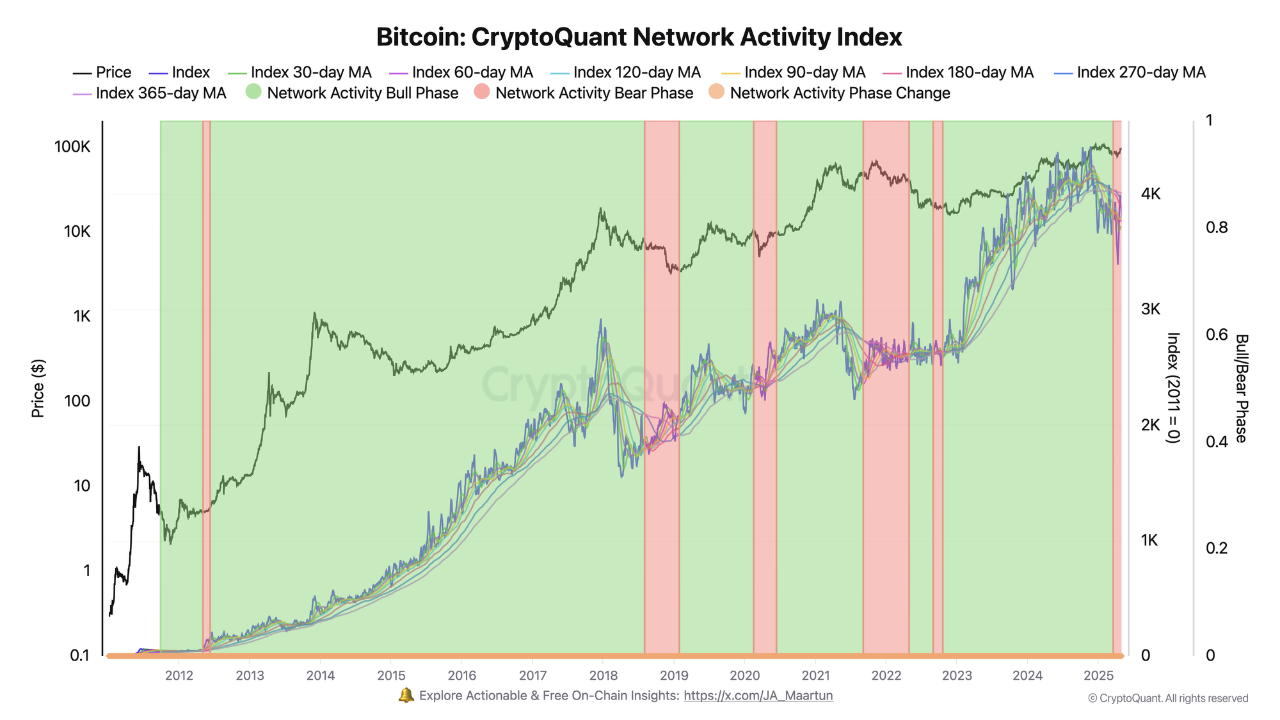
CryptoQuant’s network activity data supports this cautious view. Active addresses and transaction counts remain flat, suggesting a lack of new user engagement. Bitcoin’s current price levels appear vulnerable without an influx of retail or institutional demand.
While BTC maintains its dominance, underlying support from key cohorts appears to be fading, raising doubts about its ability to sustain further upside without renewed accumulation, which could help SUI price outperform the prime crypto token.
Descending Triangle Threatens Deeper Bitcoin Breakdown
Bitcoin’s weekly chart now reveals a descending triangle pattern, a bearish continuation setup that often signals a breakdown in price momentum. The structure is defined by a horizontal support base aligning with the $80,000 region and a descending trendline that caps lower highs over multiple weeks. This tightening structure reflects weakening buying pressure, as sellers dominate near resistance.

Descending triangles typically resolve to the downside, with price breaking below the horizontal base once demand fails to absorb the selling pressure. The pattern’s price target is calculated by measuring the triangle’s height from the horizontal base to the highest peak and projecting that vertically below the breakdown level.
In this case, a breakdown from the $80,000 support region would target a potential move toward the $50,000 zone, coinciding with the 2024 consolidation range. The setup is more concerning because it’s forming just as key on-chain metrics turn bearish. Whales appear to be distributing, not accumulating.
Network activity remains subdued. Combining a bearish technical structure with fading on-chain support strengthens the case for a deeper correction if BTC fails to break the descending trendline decisively. Price must reclaim the falling resistance to invalidate the setup. Until then, downside risks remain in focus, and SUI could outpace the token in the near future.
Moreover, if BTC starts rallying, the resulting market-wide euphoria could help buoy Sui Network prices.
