
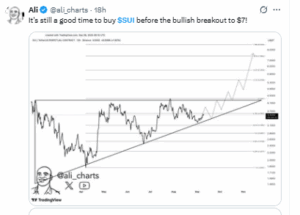
Sui (SUI) traded near $3.60 on Thursday, and several analysts expect the token to attempt higher levels. Trader Ali (@ali_charts) said SUI remains in a bullish setup and could rise to $7 if it breaks above $4.20. His chart shows an ascending triangle pattern, which is a shape that often leads to upward price continuation. Using Fibonacci levels, he mapped potential targets at $4.79, $5.30, $6.19, and $7.39.
Trader Lucky (@LLuciano_BTC) also noted that SUI has followed a similar pattern several times this year: steep declines followed by strong rebounds. He argued that the latest recovery from $3.20 could repeat this cycle, with the next upside level near $5.30–$5.50.
Leon Nguyen (@leonnguyen444) offered a longer-term view. He predicted that SUI could retest its all-time high at $5.35 in September and climb to $15 by year-end. Nguyen linked this outlook to possible exchange-traded funds (ETFs) tied to Sui and ecosystem developments such as the SuiPlay 0X1 launch.
Support at $3.20 Holds as $4.20 Resistance Looms
Charts show that SUI price is holding firm above $3.20–$3.50, which has acted as a price floor in recent months. Support is the level where buyers usually step in to stop further declines. The main challenge is $4.20–$4.30, which has repeatedly blocked rallies this year. Resistance is the opposite of support — a price ceiling where selling pressure tends to appear.
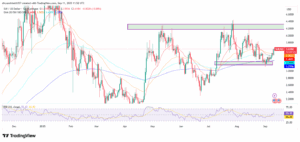
Momentum indicators suggest the market is stable. The Relative Strength Index (RSI) is at 55. RSI runs on a scale from 0 to 100. Values below 30 usually mean an asset is oversold and may rebound, while values above 70 indicate it is overbought and may face selling. A reading near 55 shows balanced momentum, leaving room for further upside if demand grows.
Moving averages also support the bullish case. SUI is trading above its 20-day and 50-day exponential moving averages, which track the average price over time. When prices trade above these averages, it often means short-term momentum has shifted toward buyers.
Ali’s Fibonacci chart places the next resistance zones at $4.79 and $5.30. If those levels are cleared, the following targets are $6.19 and $7.39. Fibonacci levels are chart-based markers that traders use to estimate where prices could face pauses or reversals.
SUI Exchange Outflows and $2B DeFi Activity Back Bullish Case
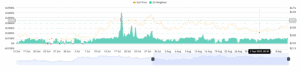
Blockchain data shows that more SUI tokens have been leaving exchanges than entering in recent weeks. When coins leave exchanges, they are often moved into storage or used in applications, which reduces the amount available for selling.
Futures data also supports steady demand. Funding rates — the small fees paid between long and short traders — are slightly positive. A positive rate means more traders are betting on SUI to rise, while a negative rate would mean the opposite. Current levels are moderate, suggesting healthy interest in longs without excessive risk.
Open interest, which measures the total value of active futures contracts, has also grown. Rising open interest shows that more traders are entering positions, increasing market activity.
Sui’s decentralized finance (DeFi) ecosystem is showing growth as well. Total value locked (TVL), the amount of money committed to Sui-based DeFi apps, has risen above $2 billion. Stablecoin supply on the network exceeds $800 million, and decentralized exchanges process about $400 million in daily trading volume. These figures indicate that there is consistent use of the network as developers continue to improve the ecosystem. Recent updates include a GraphQL RPC and a general-purpose indexer to make it easier for builders to access blockchain data.
Recent reports also confirm that Sui representatives have met with the U.S. Securities and Exchange Commission (SEC) ahead of ETF filing deadlines. Analysts say this step could help attract more institutional interest.
Analysts see near-term targets between $5.30 and $7 if SUI price breaks resistance at $4.20. Longer-term forecasts, such as $15 by year-end, depend on ETF approval and overall crypto market strength.
For now, the $3.20–$3.50 support zone is the foundation for bulls, while $4.20 remains the barrier that must be cleared to confirm any breakout.
