
SYRUP, the native token of Maple Finance, recorded a 3.34% price gain over the last 24 hours, pushing its monthly growth above 40%. This upward movement follows a sharp liquidity inflow from both spot and on-chain investors. However, retail derivative traders continue to bet against the rally, positioning for a decline.
Liquidity Surge Pushes TVL to New High
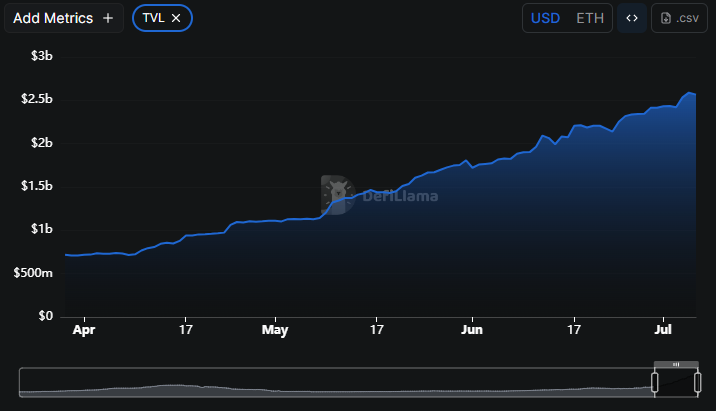
Data from DeFiLlama shows that Maple Finance’s Total Value Locked (TVL) hit an all-time high of $2.588 billion on July 5. This marks a 26% increase over the last 30 days, confirming steady capital inflow into the protocol. The jump reflects rising investor confidence, with large sums of SYRUP deposited in a short timeframe.
This surge came as both retail investors and institutional players increased their holdings. Analysts note that the move indicates a long-term accumulation strategy, especially given the size and timing of the deposits.
Smart Money Pours Into SYRUP as Top Target Amid Broader Accumulation Trend
Maple Finance’s SYRUP token has emerged as the top choice among smart money investors, according to new data from Nansen. In the last 24 hours alone, SYRUP recorded $1.56 million in inflows from wallets tagged as high-conviction traders. Over the past week, these wallets accumulated a total of $4.69 million, reinforcing strong investor interest.
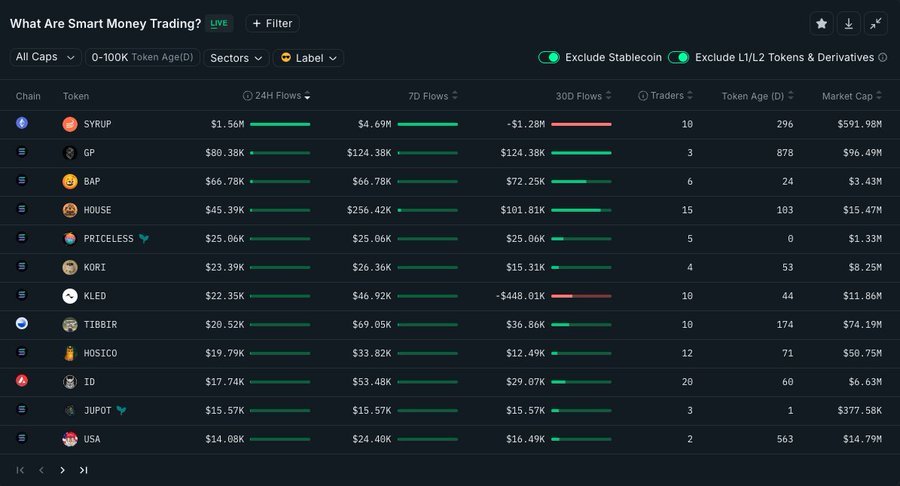
Despite a net outflow of $1.28 million over the 30-day window, recent activity signals renewed momentum. Among all tokens tracked by Nansen’s smart money dashboard, SYRUP leads in daily and weekly inflows, outperforming others such as GP, BAP, and HOUSE.
Currently, 10 smart money wallets are actively holding SYRUP. The token has a market cap of $591.98 million, making it one of the larger-cap assets on the list. Notably, this level of accumulation surpasses the flows into smaller-cap projects like BAP ($66.78K in 24h) and HOUSE ($45.39K in 24h).
Spot Wallet Activity Supports Long-Term Outlook
Supporting this trend, CoinGlass data shows that SYRUP has recorded a four-day buying streak on spot exchanges. Over $1.2 million in tokens were moved from exchanges into private wallets—often seen as a signal of long-term holding strategies. This behavior typically aligns with investor expectations of price appreciation.
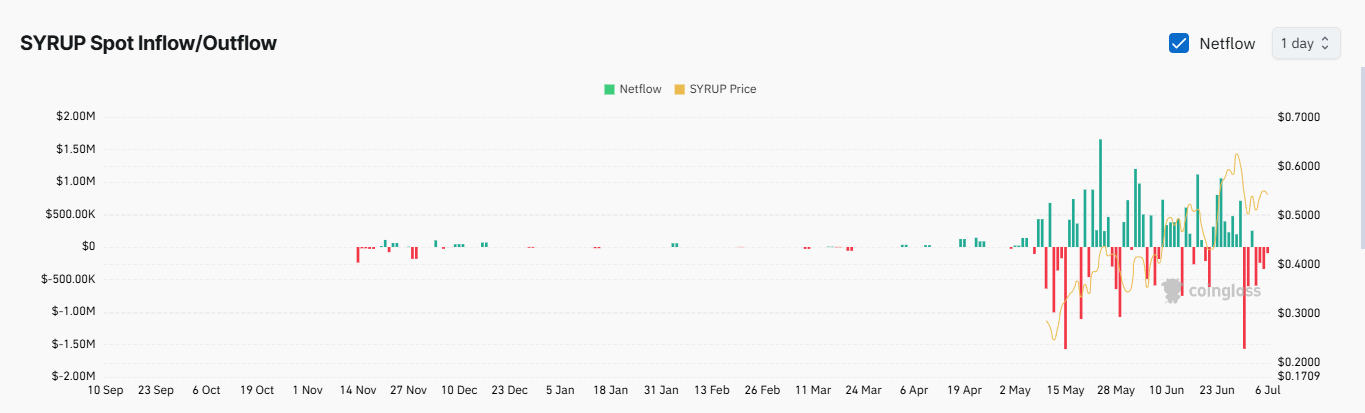
The volume of spot buying and private transfers also mirrors the rising Total Value Locked (TVL) in the Maple Finance protocol, which recently surged to $2.588 billion. The alignment of protocol growth with on-chain smart money behavior strengthens the argument for sustained upward momentum.
As SYRUP continues to draw capital from both institutional and retail investors, analysts are watching whether this surge in conviction buying can offset pressure from derivative markets, where traders remain split on short-term direction.
Derivative Traders Short SYRUP as Funding Rate Drops to Negative Zone
While spot and on-chain investors continue accumulating SYRUP, the derivatives market shows a clear divergence. As of July 6, the Open Interest (OI) Weighted Funding Rate turned sharply negative, signaling bearish sentiment among leveraged traders.
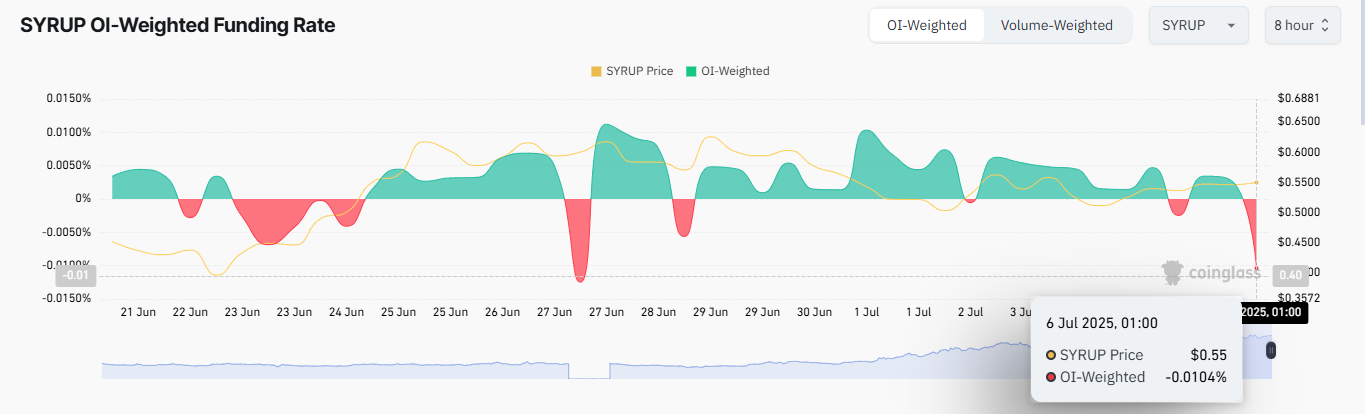
According to data from CoinGlass, the OI-Weighted Funding Rate fell to -0.0104%, marking a significant shift from the neutral-to-positive trend seen in recent days. This drop indicates that short positions now dominate, with traders paying a premium to bet against further upside.
This funding rate decline suggests growing skepticism about SYRUP’s ability to sustain its recent gains. If the negative rate persists or deepens, SYRUP could face a short-term correction despite strong fundamentals in the spot and DeFi markets.
Notably, the price of SYRUP hovered around $0.55 at the time of the funding rate drop. While long-term accumulation trends remain intact, the derivatives data shows that traders expect short-term pressure or consolidation before any renewed rally.
The contrast between strong spot inflows and bearish funding rates highlights a tug-of-war between long-term holders and short-term speculators.
SYRUP Forms Bearish Pennant, Suggests 19% Price Drop Toward $0.4211
On July 7, 2025, a bearish pennant pattern formed on the 4-hour SYRUP/USDT chart published via TradingView. This continuation pattern usually appears after a sharp downward move, followed by a short consolidation phase with converging trendlines. If confirmed, it typically leads to another price decline matching the length of the prior drop.
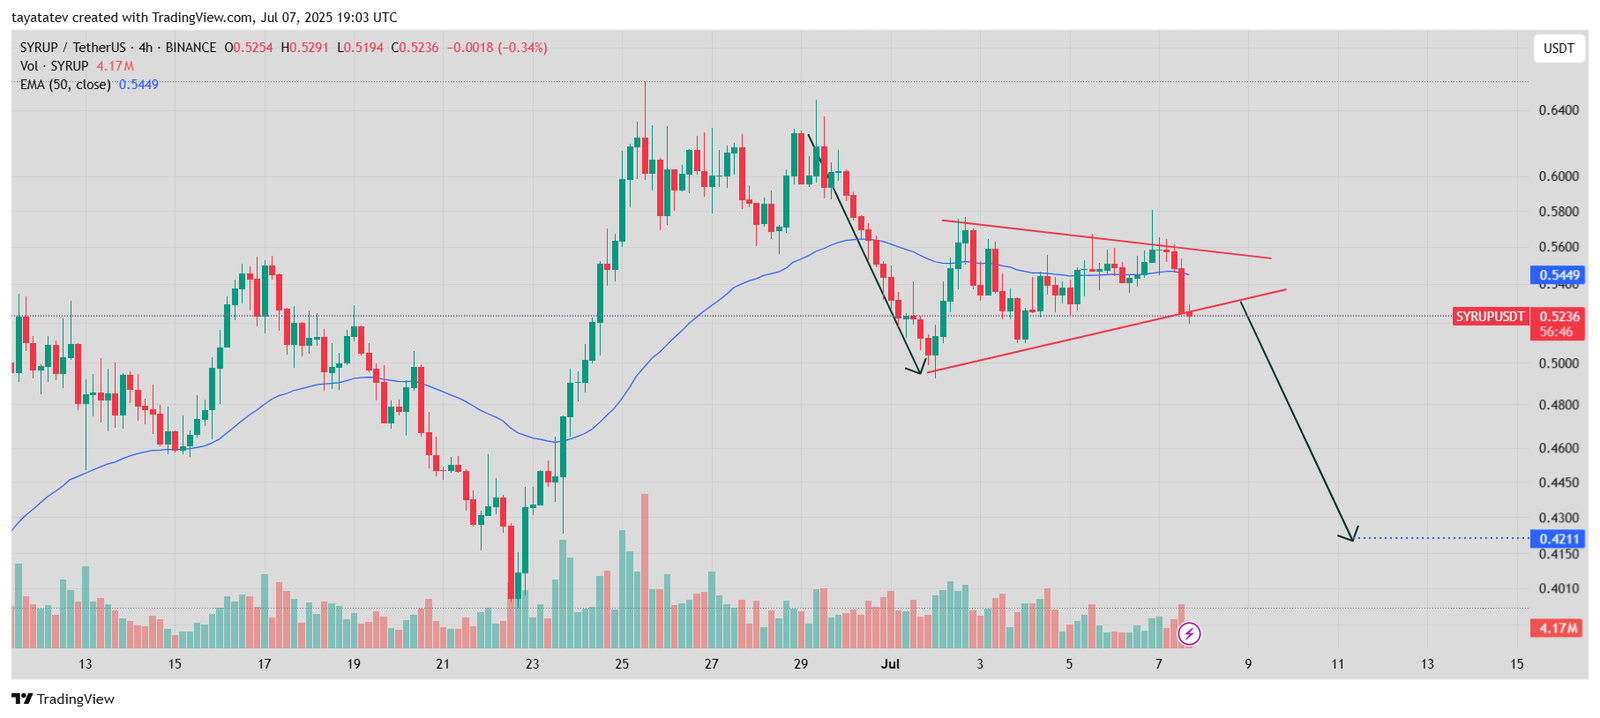
In this case, the pennant formed after a steep fall from around $0.64. SYRUP is now trading near $0.5236, slightly below the 50-period Exponential Moving Average (EMA), which sits at $0.5449. The pattern breakdown points to a potential 19% decline, which would take SYRUP down to $0.4211, based on the measured move from the flagpole’s height.
Volume has started to increase again as the price moves downward—supporting the validity of the breakout. This combination of technical weakness and broader bearish sentiment in derivatives markets (as seen in the negative funding rate) strengthens the case for a deeper correction in the short term.
SYRUP RSI Breaks Below Midline, Signals Weakening Momentum
On July 7, 2025, the Relative Strength Index (RSI) on the SYRUP/USDT chart dropped sharply to 39.49, breaking below the neutral 50 level. The RSI, calculated over a 14-period window, measures the speed and magnitude of recent price changes. A reading below 50 suggests bearish momentum is gaining strength.
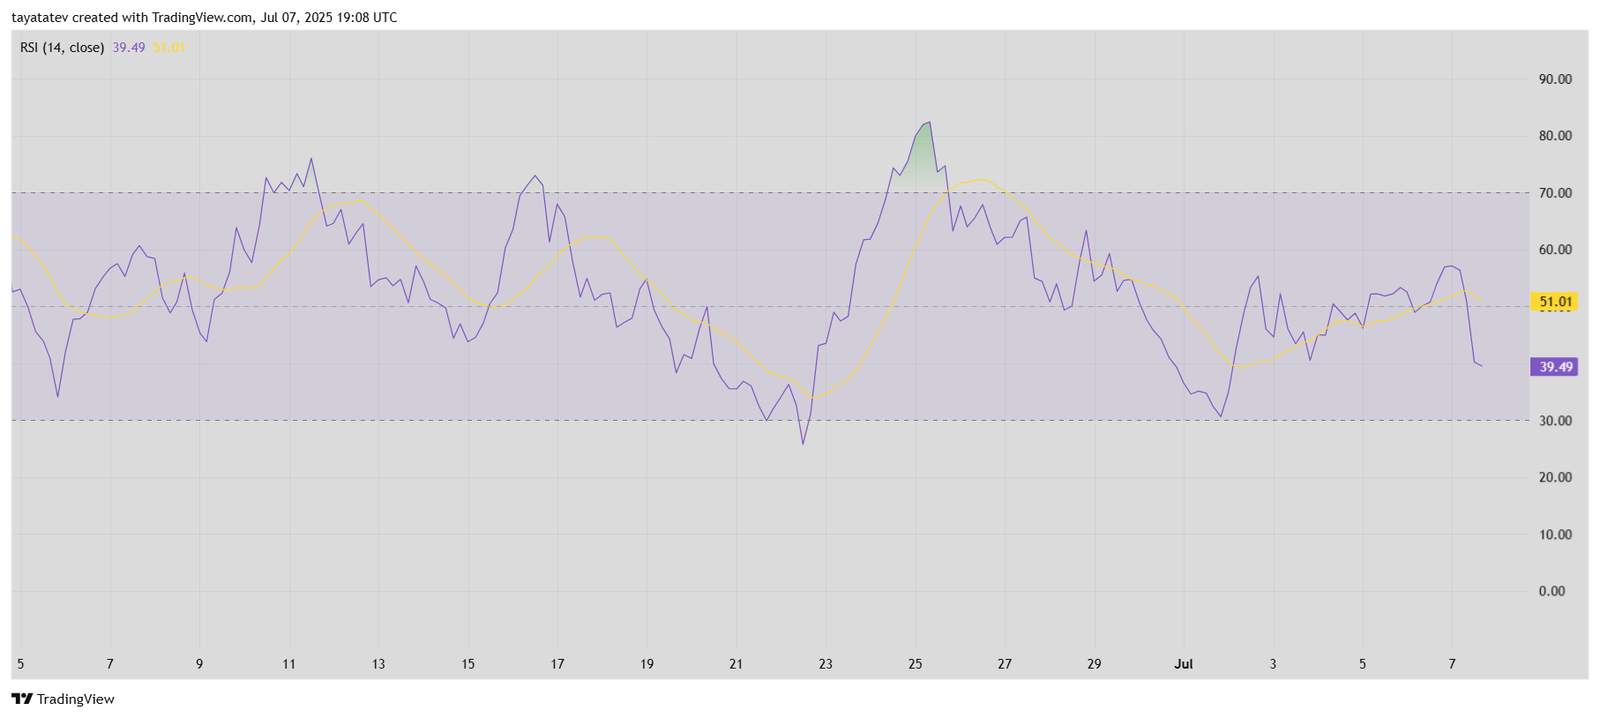
Before this drop, the RSI hovered near 51.01, indicating indecision. However, the latest movement confirms sellers are taking control. The sudden dip in RSI follows the breakdown from a bearish pennant pattern seen on the 4-hour chart and aligns with negative sentiment in the derivatives market.
In addition, the RSI continues to trend beneath its moving average (yellow line), reinforcing the view that SYRUP could face further downside pressure unless buyers step in quickly.
