
On June 4, 2025, the Bittensor TAOB/USDT pair formed a bullish flag pattern on the 1-hour chart.
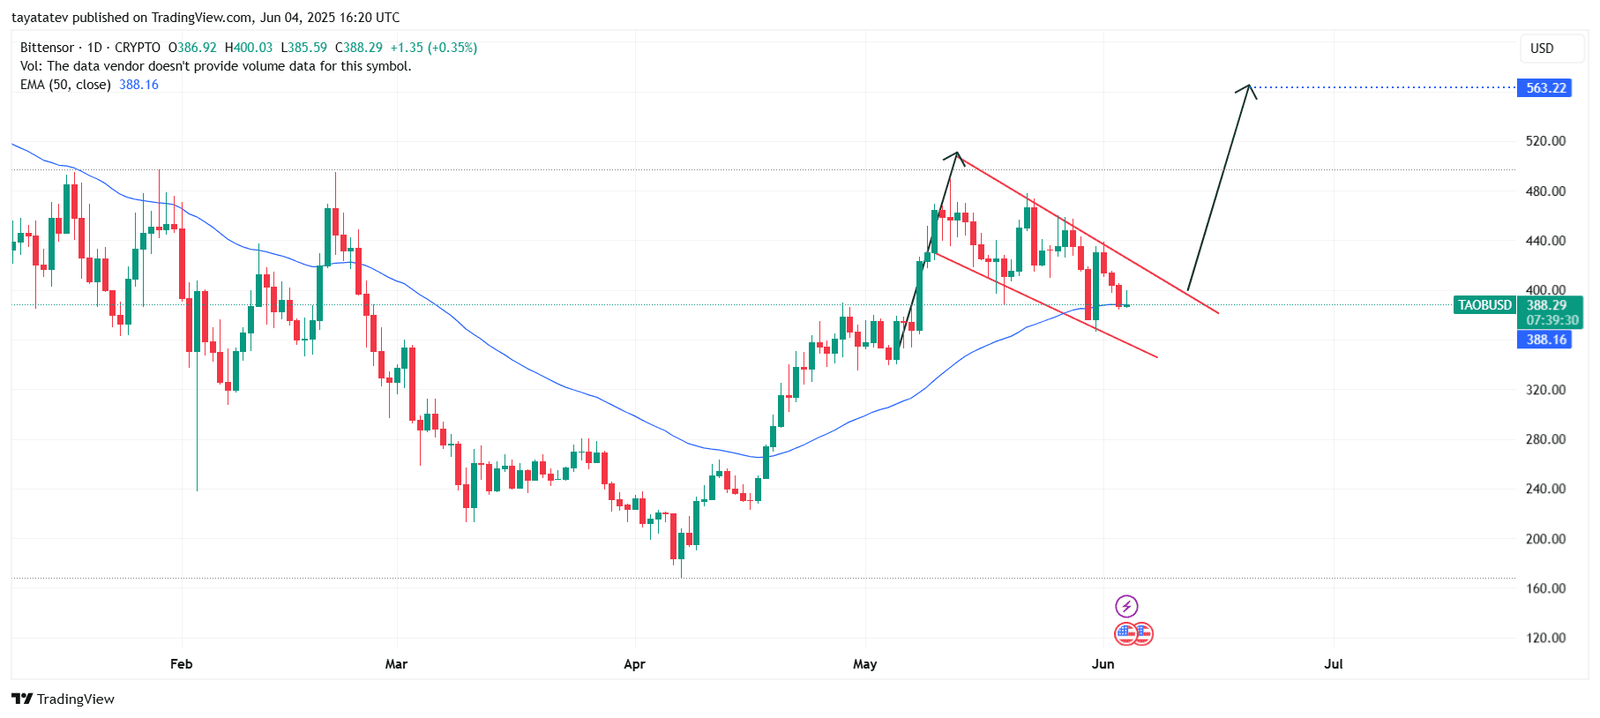
A bullish flag pattern forms after a strong upward price move, followed by a brief consolidation inside parallel, downward-sloping lines, and it usually signals a continuation of the prior uptrend.
Currently, TAOB/USDT trades near $0.00567. If the pattern confirms with a breakout above the upper red trendline, the price may rise 46 percent from the current level. This projected move targets approximately $0.00828.
The flag’s consolidation range remains tight, showing decreasing volatility. The 50-period Exponential Moving Average (EMA), positioned at $0.00575, acts as immediate resistance. If TAOB/USDT closes above both the EMA and the flag’s upper boundary, it will confirm the bullish breakout.
Volume must rise on the breakout to validate the move. If that happens, the price is likely to climb toward the target zone around $0.00828. The pattern remains valid as long as the price stays within the flag boundaries and does not fall below the recent low near $0.0053.
Directional Movement Index (DMI) shows strengthening +DI and fading -DI, hinting at growing bullish momentum.
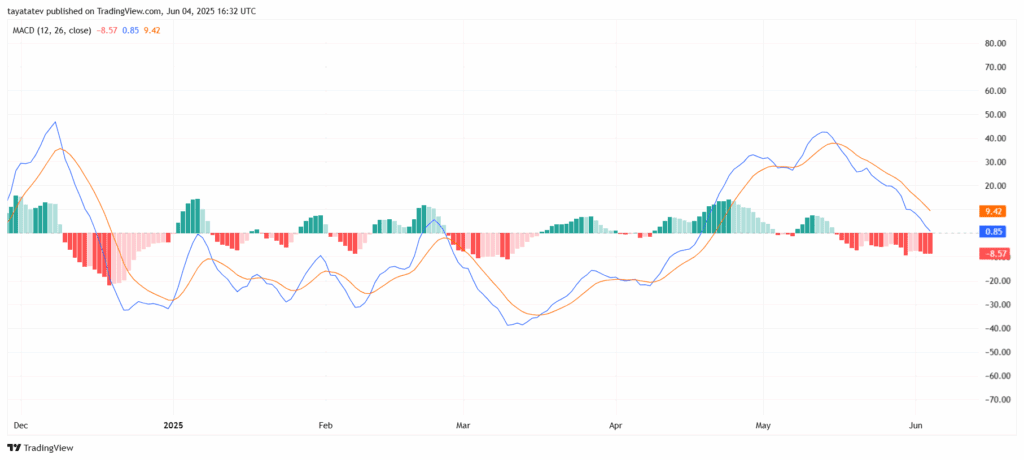
This crossover indicates bearish momentum. The histogram bars continue to extend downward, which reflects increasing negative pressure. The gap between the MACD and the signal line is also widening, reinforcing the strength of the current downtrend.
There is no visible sign of reversal yet. Momentum remains bearish unless the MACD line starts to converge toward the signal line or the histogram begins to rise back toward zero. As it stands, price action likely continues to face downward pressure.
RSI Drops Below 50, Confirms Bearish Momentum Shift
The Bittensor TAOB chart, published on June 4, 2025, at 17:01 UTC, shows the Relative Strength Index (RSI) indicator using a 14-period setting.
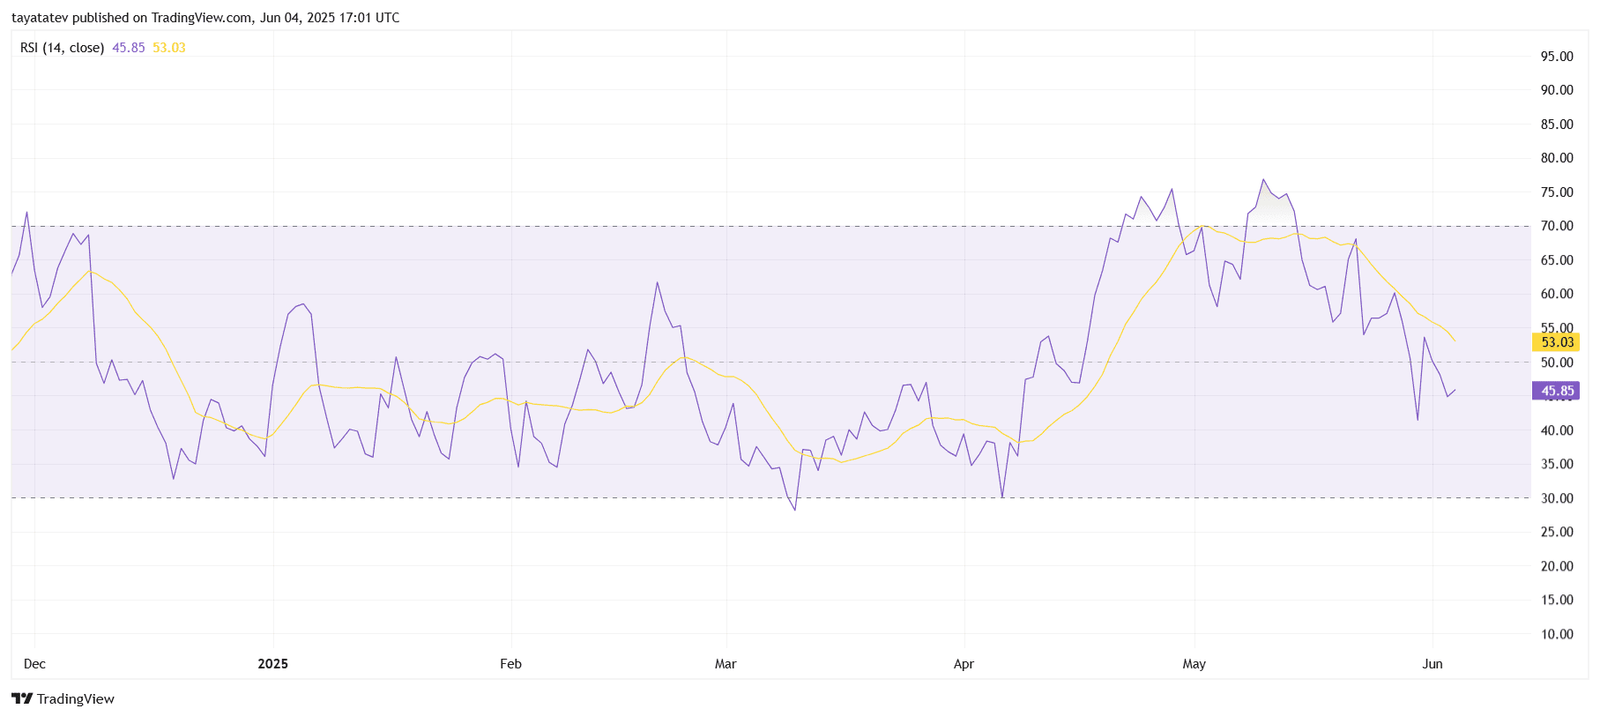
The current RSI value is 45.85, while its moving average (yellow line) is at 53.03. The RSI has dropped below the 50 level, moving from overbought territory above 70 in early May to now trending in the lower neutral zone.
This shift confirms weakening buying pressure. As long as RSI remains below its moving average and below the 50 mark, momentum favors sellers. The recent bounce near 40 signals minor support, but it lacks strength without a crossover or rising slope.
If RSI drops closer to 30, it may approach oversold territory. Until then, the indicator signals bearish momentum and limited upside strength.
