YEREVAN (CoinChapter.com) – THORChain (RUNE) surged 12% in the past 24 hours to reach $9 Thursday’.
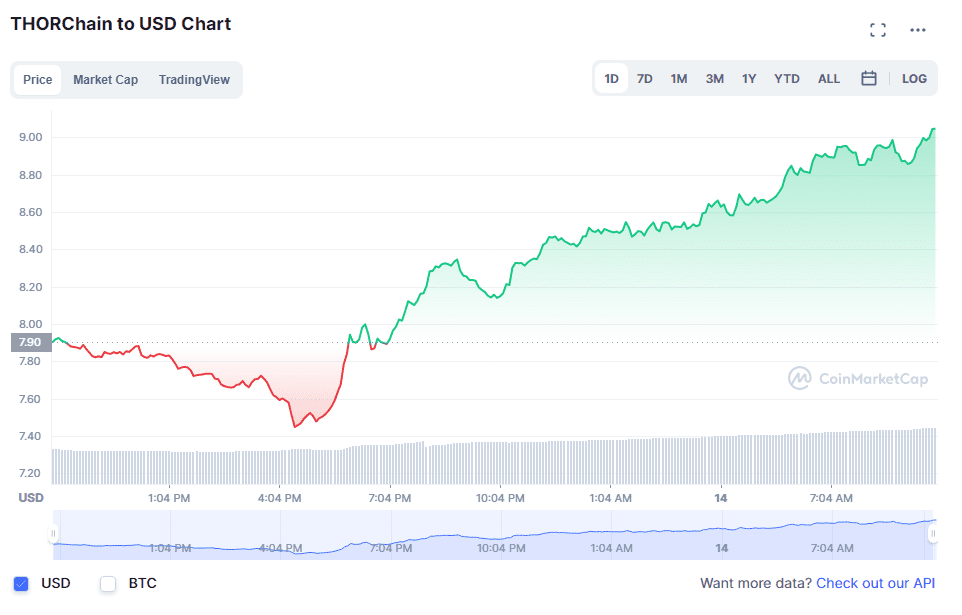
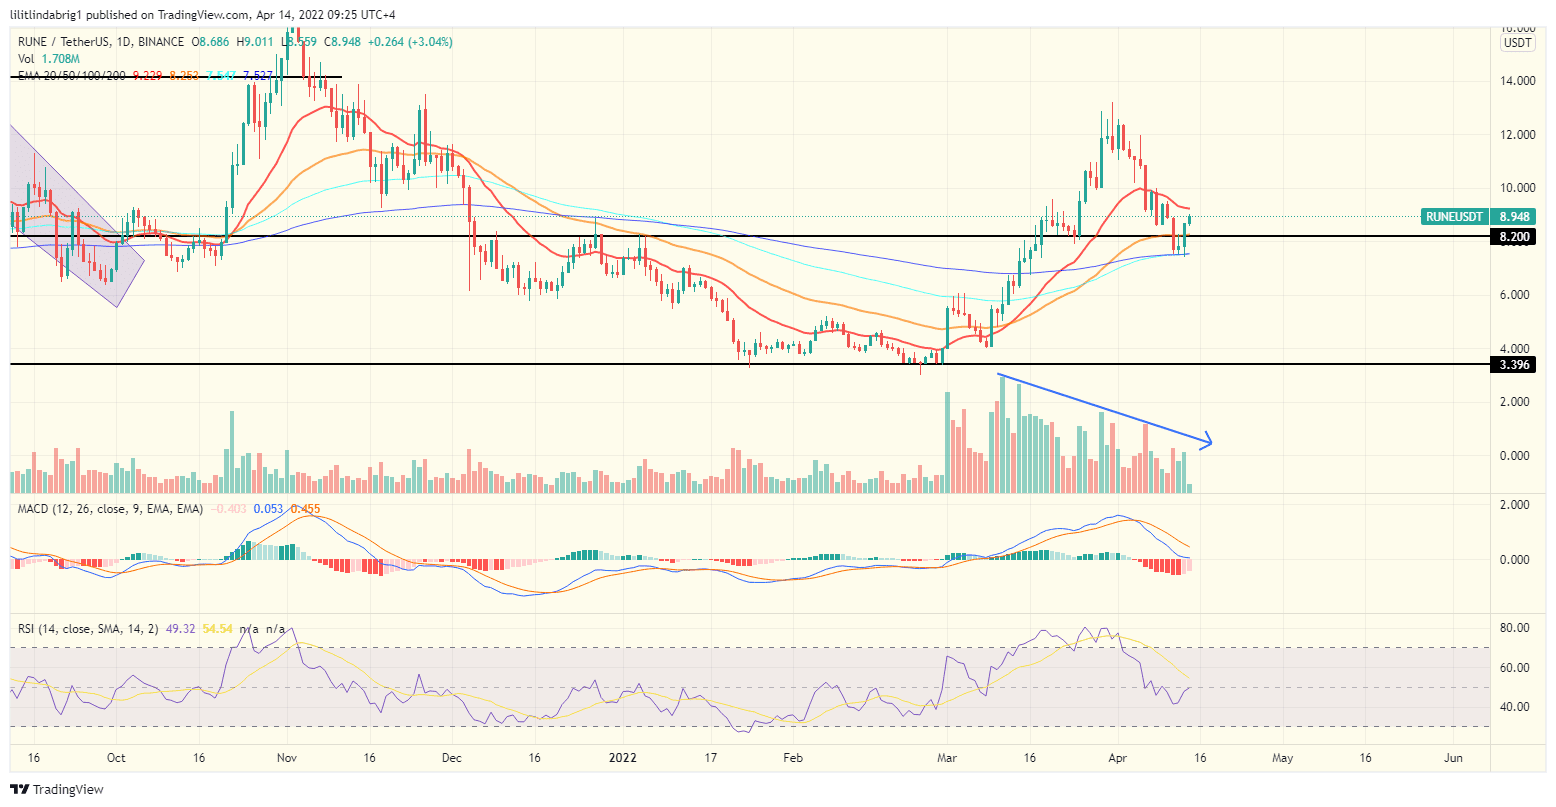
THORChain (RUNE) daily chart
Despite its strong intraday move, THORChain risks correcting lower.
In detail, the THORChain token dropped over 40% month-to-date from its local top. However, it met a confluence of support from its 100-day exponential moving average (EMA-100) and EMA-200. Additionally, RUNE held on to a significant resistance-turned-support line at $8.2, which could back the digital asset in case of a correction.
Also read: THORChain risks correction after RUNE price doubles in over a week — what’s next?
Meanwhile, RUNE also faced a flurry of bearish technicals. For example, the token’s trading volumes have been declining since mid-March, indicating growing passivity among THORChain traders. Additionally, the trend-based MACD oscillator (histogram at the bottom) hinted at a short-term bearish continuation, as the histogram was not yet ready for a green crossover.
The weekly chart technicals
Moreover, zooming out to the weekly chart revealed further concerns for RUNE bulls, as the chart formed a Descending Triangle. The setup consisted of a flat support line at $3.4 and a falling trendline connecting all three of RUNE’s local tops.
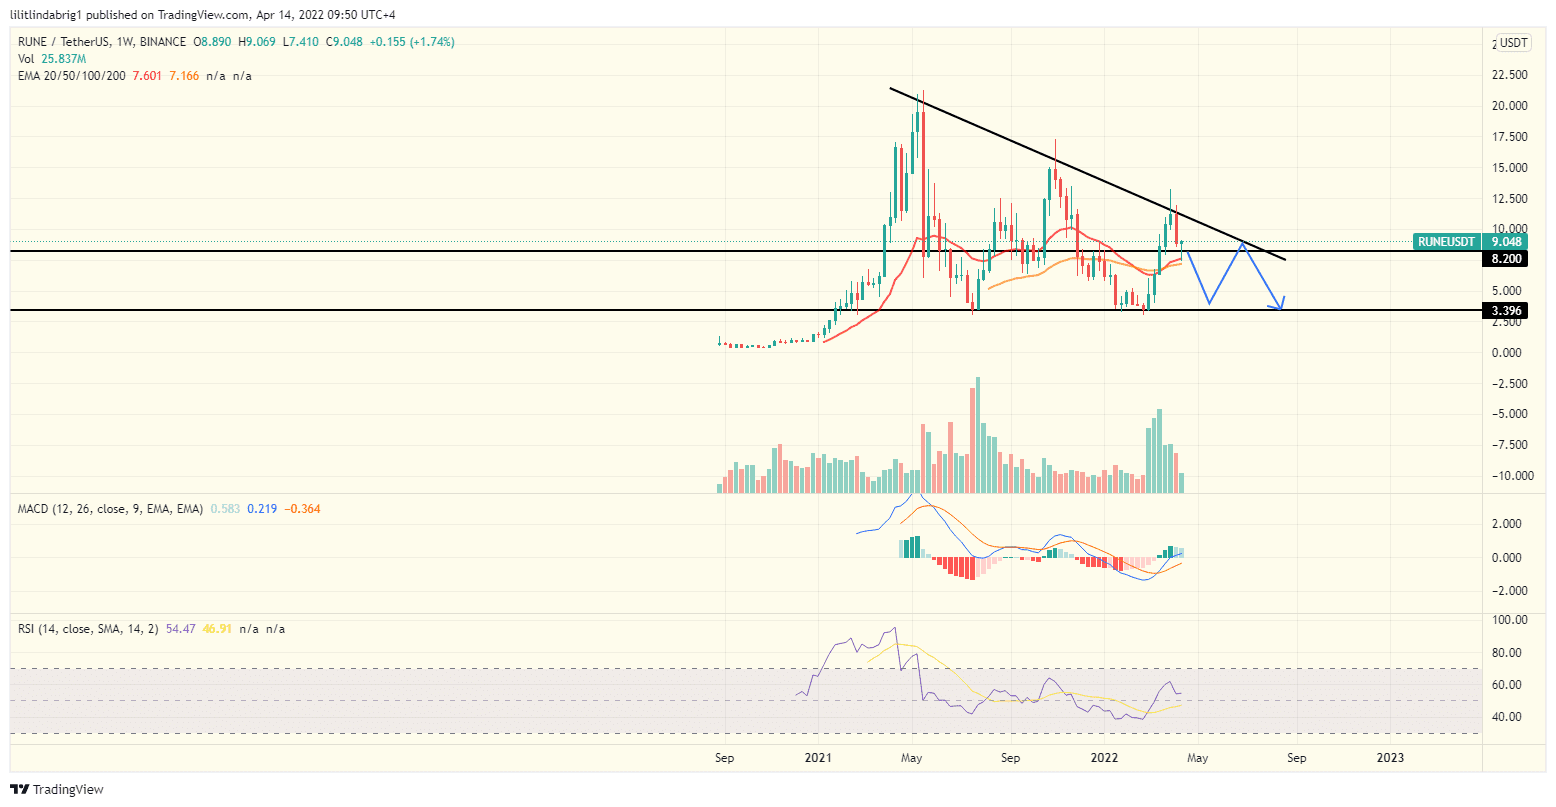
The trendlines enclose the price action while lowering the swing. Thus, after the resistance retest two weeks ago, traders could expect a subsequent decline toward the setup’s support, constituting a 60% drop in value.
However, should RUNE hold the mentioned rebound level at $8.2, it could gain a short-term bullish impulse and rise to approximately $10.5. The said level lies at the Triangle’s resistance.
Also read: THORChain’s RUNE jumps 77% week-to-day as synthetic assets go live.
Notably, THORChain’s bias remains dependent on the overall conditions across the digital asset sector. The token could swing higher if Bitcoin manages a break or lower if the flagship crypto drops in the upcoming sessions. As of Apr. 14, RUNE/USD charts appeared bearish.
