
NAIROBI (CoinChapter.com)— Toncoin (TON) price shows signs of recovery despite a 2.15% drop in the last 24 hours, hinting at a potential rally. Currently trading at $4.84, the token holds a total market valuation of $12 billion. The asset’s price action suggests a possible bullish breakout, but a surge in exchange supply could challenge its upward momentum.
Toncoin’s Bullish Reversal Signals Strength Amid Market Weakness
Toncoin’s daily chart presents multiple bullish reversal patterns, reinforcing a potential breakout. The token has formed a falling wedge pattern, a historically bullish structure, with price action converging toward a narrowing range. Currently, TON is testing critical support at $4.67–$4.77, an area that has held firm over the past few months.
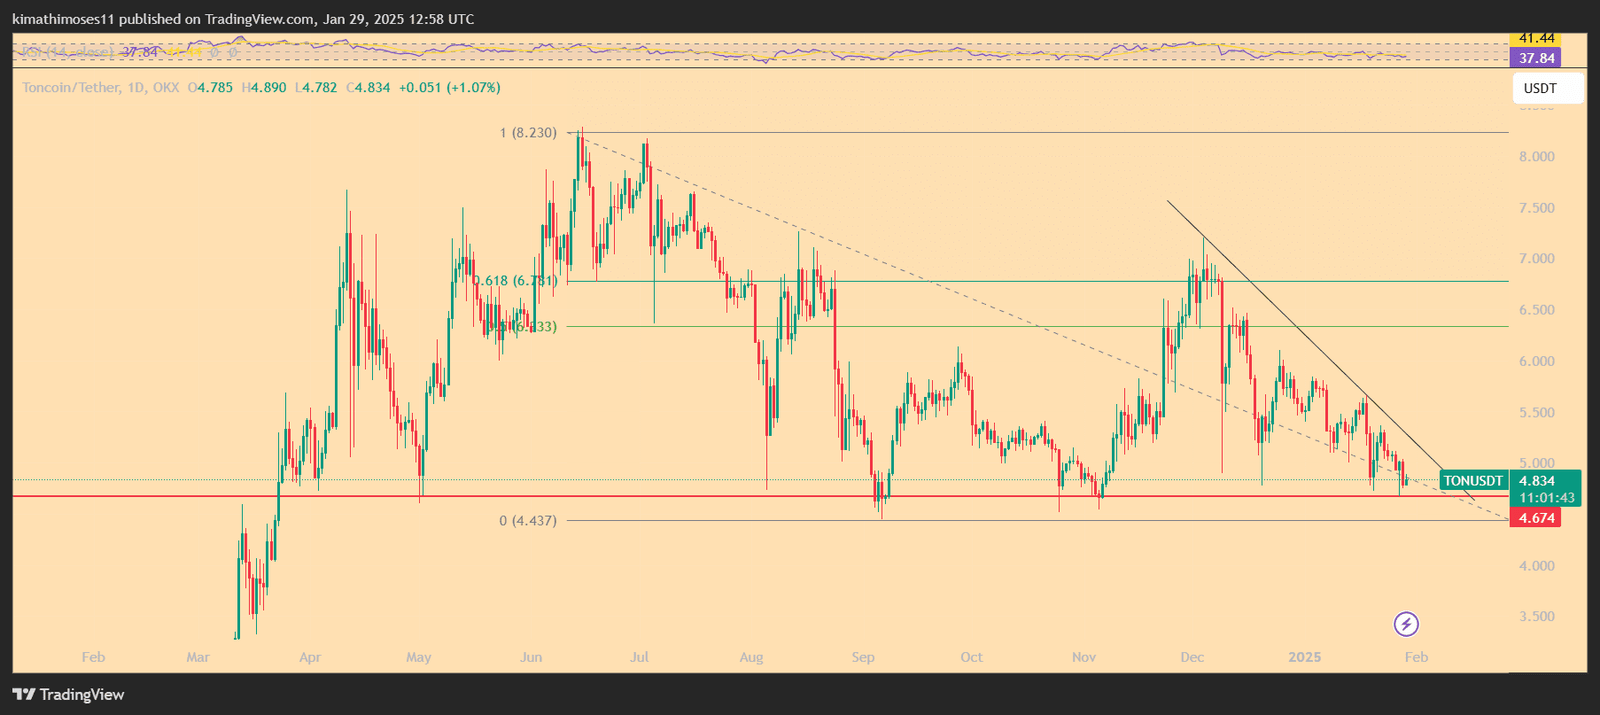
The Relative Strength Index (RSI) sits at 37.64, indicating oversold conditions. A slight bullish divergence suggests that downward momentum is losing steam, increasing the possibility of a reversal. The price has also respected the Fib retracement zone, with the 0% Fib level at $4.43 acting as the ultimate support, while the 0.618 Fibonacci level at $6.78 remains a key upside target.
A breakout from the falling wedge would require a move above the descending trendline near $5.00. This level coincides with the 23.6% Fibonacci retracement, making it a critical threshold. If TON clears this resistance, bulls could push toward $5.72 and further extend gains to $6.78–$6.81, aligning with the 1.618 Fibonacci extension.
Failure to hold the $4.67 support could invalidate the bullish thesis, potentially exposing Toncoin to a retest of the psychological $4.43 zone. However, as long as buyers defend the wedge’s lower boundary, the probability of an upside breakout remains intact.
Exchange Inflows Raise Concerns
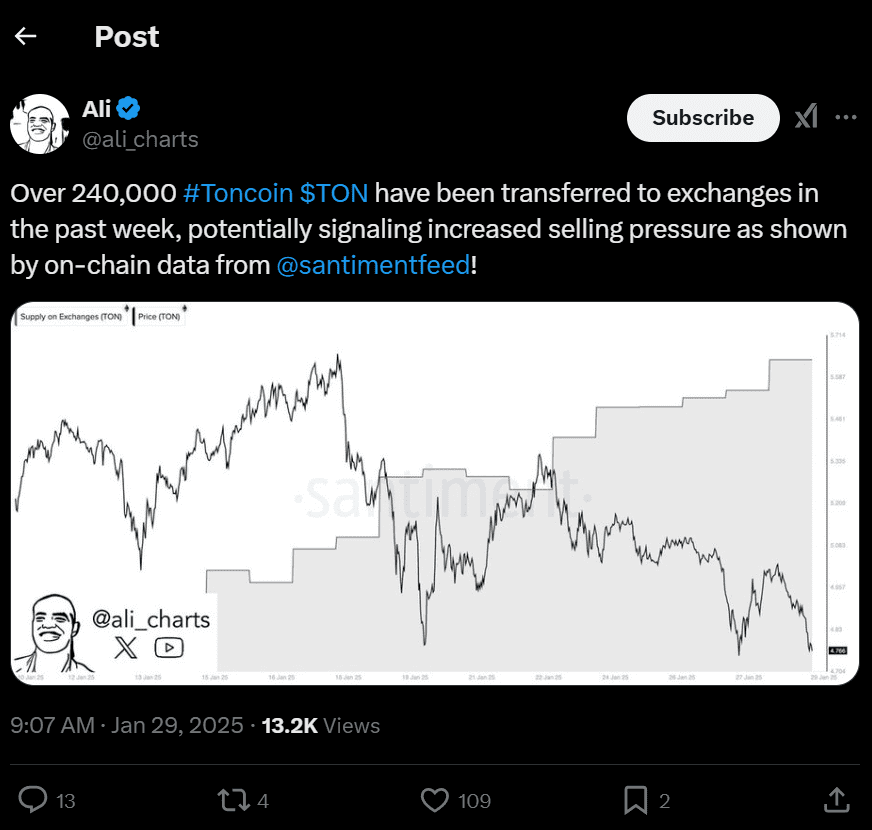
Despite bullish technical signals, on-chain data suggests rising selling pressure. Independent analyst Ali Martinez highlighted an influx of 240,000 TON tokens into exchanges over the past week, based on data from Santiment. Such inflows often indicate potential profit-taking, which could limit upward momentum.
A breach of the $4.77 support level could accelerate losses, pushing TON toward $4.60 or even the $4.00 psychological mark. This scenario would invalidate the bullish outlook, exposing the token to further downside risks.
Can Toncoin Sustain Its Bullish Trend?
Toncoin faces a critical test as supply pressure increases while technical indicators favor a rally. The in-and-out-of-the-money-around-price (IOMAP) metric from IntoTheBlock highlights resistance between $4.87 and $5.02, where 665.47 million TON tokens are concentrated.

However, the support zone between $4.72 and $4.87 holds nearly 17 million TON tokens, providing a safety net for buyers. If demand outweighs supply, TON could continue its ascent toward the projected targets.
Conclusion
Toncoin’s price outlook remains mixed as bullish reversal patterns face headwinds from increasing exchange supply. A breakout above $5 could trigger a move toward $5.72 and $6.73, but failure to hold $4.77 may push the price lower.
