
Verb Technology, a Nasdaq-listed company, has confirmed a $713 million Toncoin stake after completing a $558 million private placement earlier this month. The firm now plans to rebrand as Ton Strategy Company as it pivots its business toward the TON blockchain.
The company disclosed that its overall treasury has grown to $780 million, with Toncoin representing the bulk of its holdings. By accumulating TON, Verb Technology aims to control 5% of the token’s circulating supply, placing itself among the largest institutional holders.
Institutional Confidence in Toncoin Grows
This aggressive allocation highlights rising institutional confidence in The Open Network (TON), the blockchain closely tied to Telegram’s ecosystem. With Telegram’s large user base offering a direct channel for adoption, Toncoin is positioning itself as one of the few projects combining retail scale with institutional backing.
As a result, Toncoin has gained visibility among fund managers seeking blockchain assets with established networks. Verb’s strategic pivot reinforces Toncoin’s standing as a credible part of institutional crypto portfolios.
Toncoin Joins BlockDAG, Stellar, and Chainlink in 2025 Rally
Toncoin now stands alongside BlockDAG, Stellar, and Chainlink as one of the projects driving crypto market recovery in 2025. Analysts cite its strong fundamentals, ecosystem growth, and deep-pocketed support as reasons for its inclusion in this group.
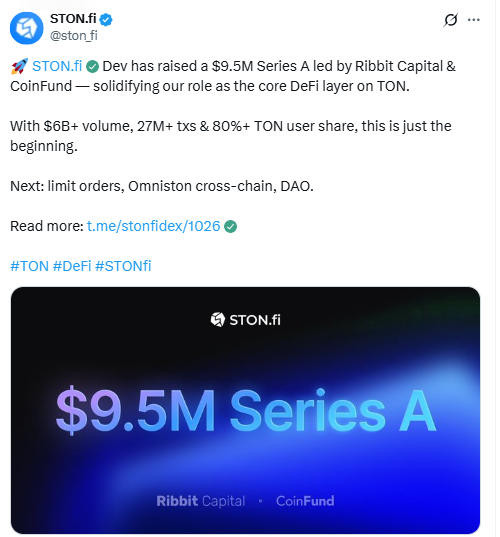
Additionally, STON.fi, a decentralized exchange built on TON, recently raised $9.5 million to expand its operations. That funding round added momentum to Toncoin’s broader ecosystem, signaling further development in decentralized finance tools tied to the network.
Verb Technology’s move demonstrates how companies are using treasury strategies to cement influence in blockchain ecosystems. By targeting a 5% Toncoin share, the firm is effectively betting on the long-term integration of TON into financial and social applications.
Meanwhile, Toncoin’s ecosystem continues to evolve with new DeFi platforms and partnerships. The combination of institutional capital and ecosystem growth is shaping TON into one of the most closely watched blockchains in 2025.
Toncoin Rising Wedge Analysis – August 22, 2025
On August 22, 2025, Toncoin traded at $3.224 against Tether TON/USDT on OKX, while the 50-day Exponential Moving Average (EMA) sat slightly higher at $3.273. Trading below the EMA signals weakening short-term momentum, which often precedes additional downside when paired with a bearish pattern. The daily trading volume measured 1.89 million TON, a relatively muted figure compared to prior breakdown phases earlier in the year. Volume trends matter here because a decisive wedge breakout usually comes with a sharp increase in participation, confirming direction.

The chart shows a rising wedge formation, which is a bearish technical setup. A rising wedge develops when price climbs inside two upward-sloping yet converging lines. Each new high becomes weaker, narrowing the space between the support and resistance trendlines. This structure highlights fading buying pressure. Historically, when the lower trendline breaks, sellers tend to accelerate, pushing price lower toward the nearest support.
In Toncoin’s case, the wedge has been forming since late June. Price repeatedly touched both boundaries but struggled to generate strong upward moves, particularly after peaking near $3.70. The latest rejection and inability to recover above the 50-day EMA emphasize that bullish momentum is weakening. If the lower trendline breaks on a daily close, the wedge projection points to a decline of roughly 21 percent from current levels, targeting the $2.55 area. That zone aligns almost perfectly with the horizontal support at $2.52, adding technical weight to the bearish target.
Until a confirmed breakdown takes place, Toncoin may continue oscillating inside the wedge. However, the structure of the pattern, the price position under the EMA, and the subdued yet potentially building volume all lean toward a bearish resolution. If selling pressure expands with higher volume, the move toward the $2.52 support zone could unfold quickly, marking the next critical test for Toncoin’s market structure.
Toncoin MACD Analysis – August 22, 2025
On August 22, 2025, the MACD (12, 26, close) for Toncoin reveals weakening momentum. The MACD line (blue) stands at 0.010, while the signal line (orange) is slightly higher at 0.039, creating a small bearish crossover. This shift signals that upward momentum is fading as sellers begin to gain control.
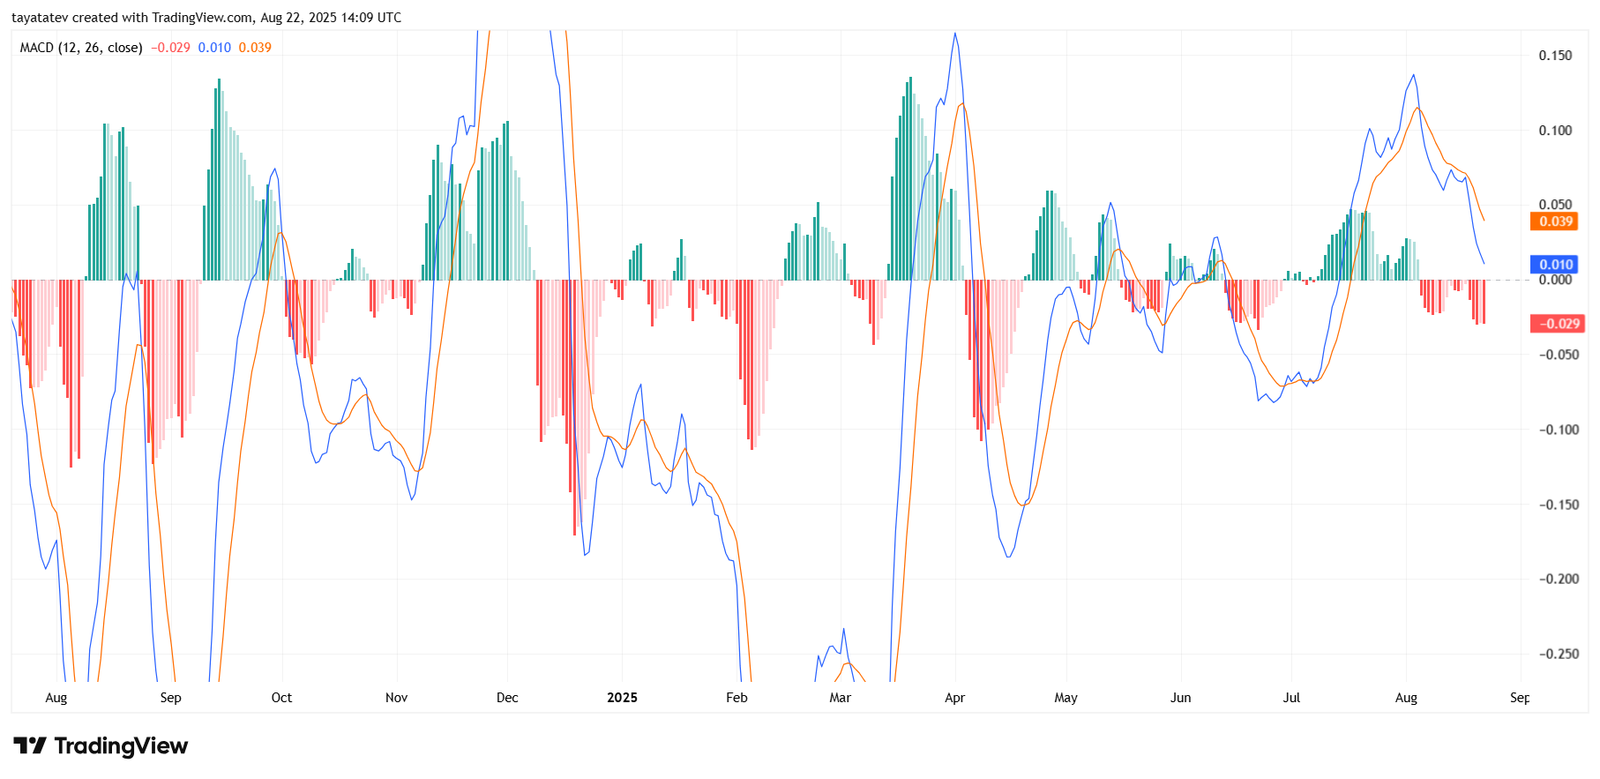
The histogram confirms this transition. After a period of positive green bars showing bullish strength, the bars have started to shrink toward the zero line, with the latest value at –0.029. Shrinking histogram bars indicate a loss of buying pressure and often precede a move into negative territory if selling accelerates.
When the MACD crosses below the signal line, as is now developing, it often acts as an early warning of a trend reversal. In Toncoin’s case, this aligns with the bearish rising wedge seen on the daily price chart. Together, the patterns reinforce the probability of a downward continuation if momentum does not recover quickly.
The overall MACD setup suggests Toncoin’s rally has lost steam. Unless the MACD line reclaims strength above the signal line with expanding green histogram bars, the indicator supports the case for a move toward the lower support area near $2.52, already identified on the price chart.
Toncoin RSI Analysis – August 22, 2025
On August 22, 2025, Toncoin’s Relative Strength Index (RSI, 14 close) printed 46.76, with its signal average line at 53.06. These levels place Toncoin in the neutral zone, slightly below the midpoint of 50, reflecting a tilt toward bearish momentum.
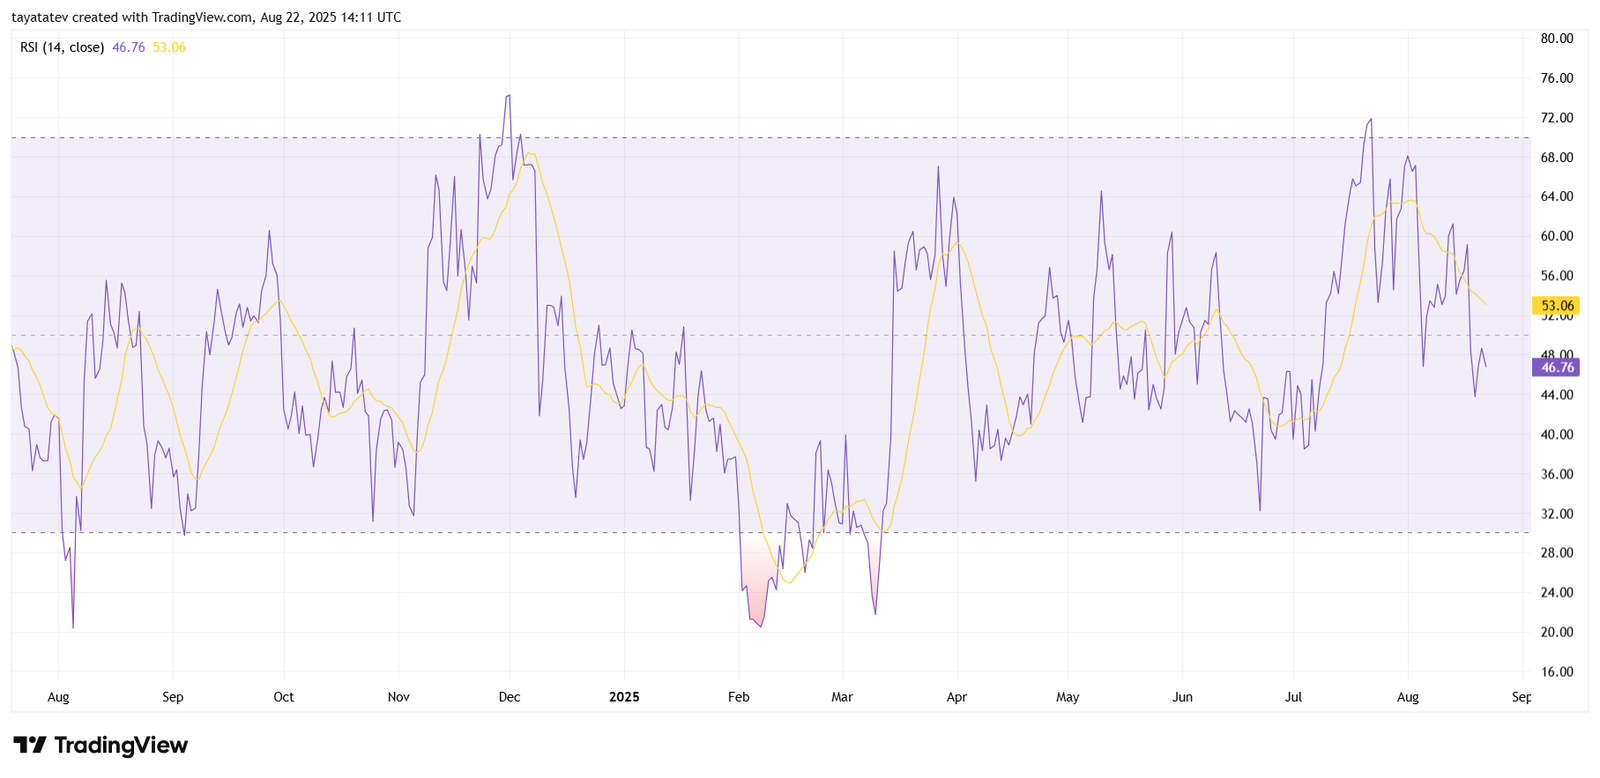
The RSI peaked above 70 in late July and early August, signaling overbought conditions at that time. Since then, the indicator has trended downward, losing strength and slipping below 50. This drop suggests that buying pressure has cooled, and sellers are gradually gaining control of the market.
Currently, the RSI is not in oversold territory, which is below 30. Instead, it shows that Toncoin has space to decline further before reaching exhaustion levels. When RSI hovers between 40 and 50, it often indicates that bearish sentiment is strengthening but not yet extreme. If price continues lower and RSI breaks toward 30, that would signal increased downside momentum, aligning with the bearish wedge and MACD signals already in play.
Taken together, the RSI confirms the weakening momentum in Toncoin’s structure. Unless RSI recovers above 50 with renewed buying strength, the indicator supports the case for further downside, with the next key support zone sitting near $2.52.
Toncoin Price Analysis – One Month Chart (CoinGecko)
The one-month TON/INR chart from CoinGecko shows Toncoin trading in a volatile but gradually weakening range. The price moved from late July levels near ₹265 up to early August peaks above ₹325, marking the month’s high. That rally showed strong upward momentum, but it quickly reversed with a sharp pullback.
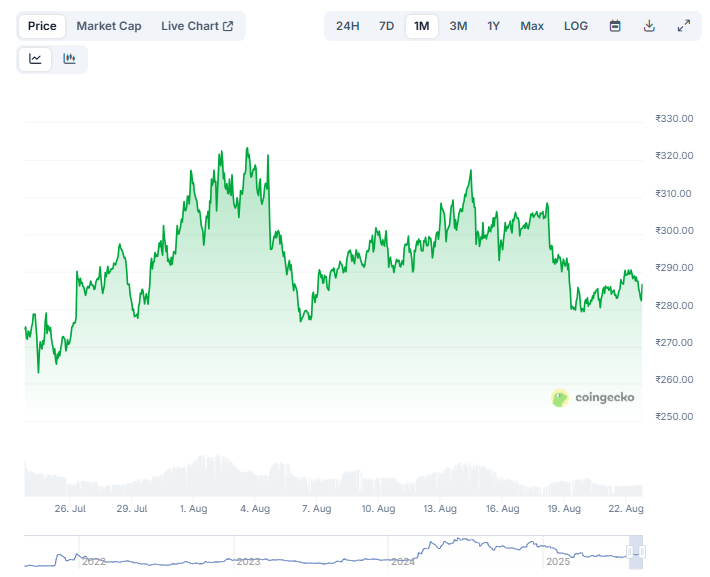
During mid-August, Toncoin attempted to recover, climbing back toward ₹310, but sellers capped the move. Since then, the token has slipped again, finding support around ₹280. This lower range highlights that buyers are no longer driving sustained higher highs.
The overall pattern reveals a series of failed rallies with progressively lower peaks. The inability to retest or break past the earlier ₹325 top points to waning bullish energy. If the ₹280 zone breaks with volume, the next potential downside target sits closer to ₹265, which was a support level tested in late July.
At the same time, holding above ₹280 could allow Toncoin to consolidate and retest the ₹300–₹310 range. However, momentum appears fragile, and the structure fits with broader bearish signals shown in technical indicators such as RSI and MACD.
