
TROLL token rose 210% in one week, reaching an all-time high of $0.106 on the Solana blockchain. At press time, the TROLL token price traded at $0.093. The meme coin has 998.98 million tokens in circulation, based on the latest data.
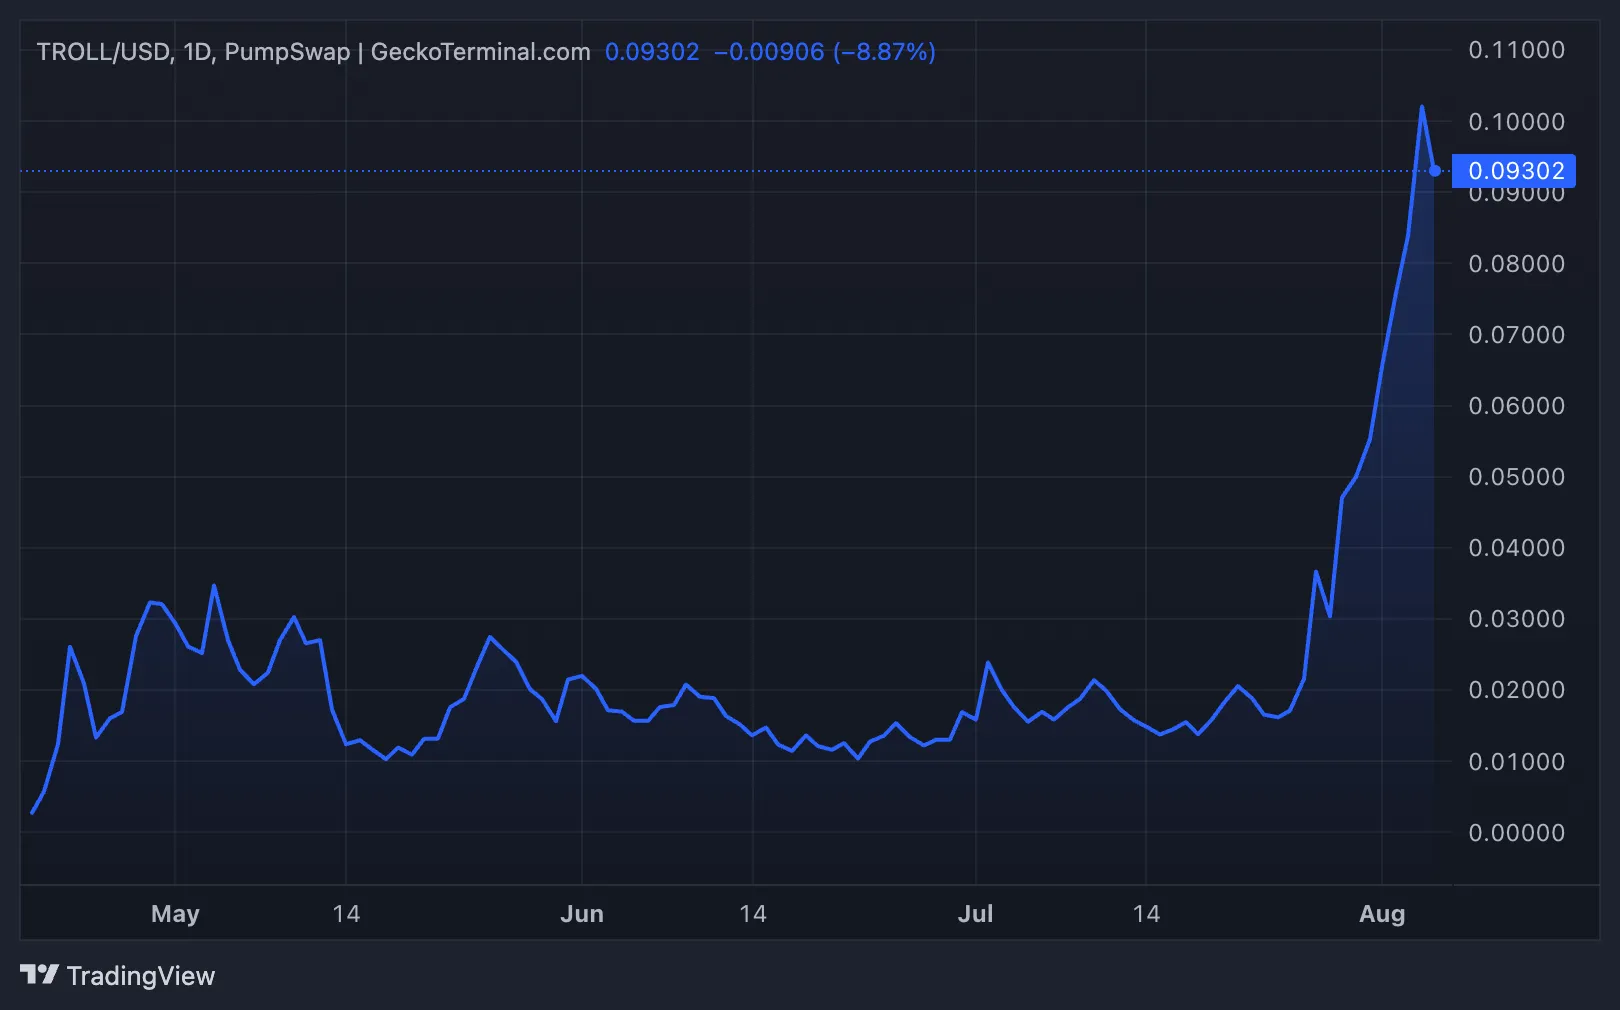
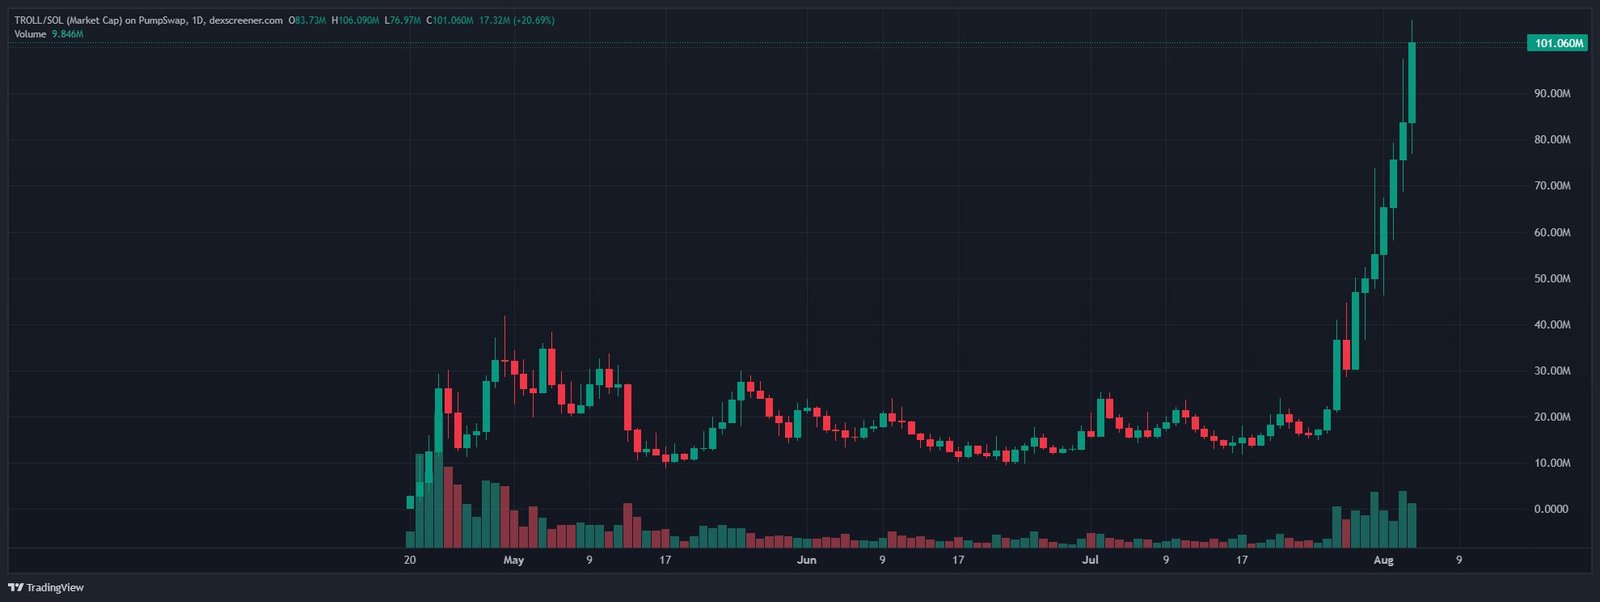
Launched 3.5 months ago, the TROLL meme coin traded in a narrow range until late July. Price action shifted upward, leading to a series of gains and the recent peak. The surge also pushed the TROLL market cap above $100 million before adjusting to $93 million.
An analyst said,
“From a long, boring base to a vertical send this is how conviction plays reward the patient. Volume’s up, and market cap’s pushing for new ATH. Next stop? Price discovery.”
Trader Gains 109x Return From TROLL Token
Lookonchain data showed a trader turned $22,800 into $2.48 million using the TROLL meme coin. The trader bought 27.86 million TROLL tokens three months ago. Later, they sold 1.28 million TROLL tokens for $16,200, while retaining 26.57 million tokens.
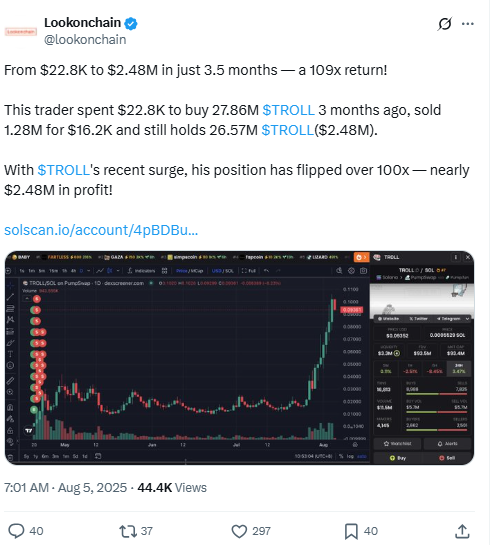
At current prices, these holdings are worth approximately $2.48 million, representing a 109x return. Lookonchain posted,
“From $22,800 to $2.48 million in just 3.5 months — a 109x return!”
TROLL token holder data shows 28,836 holders, with the top 10 wallets owning 16.1% of the circulating supply.
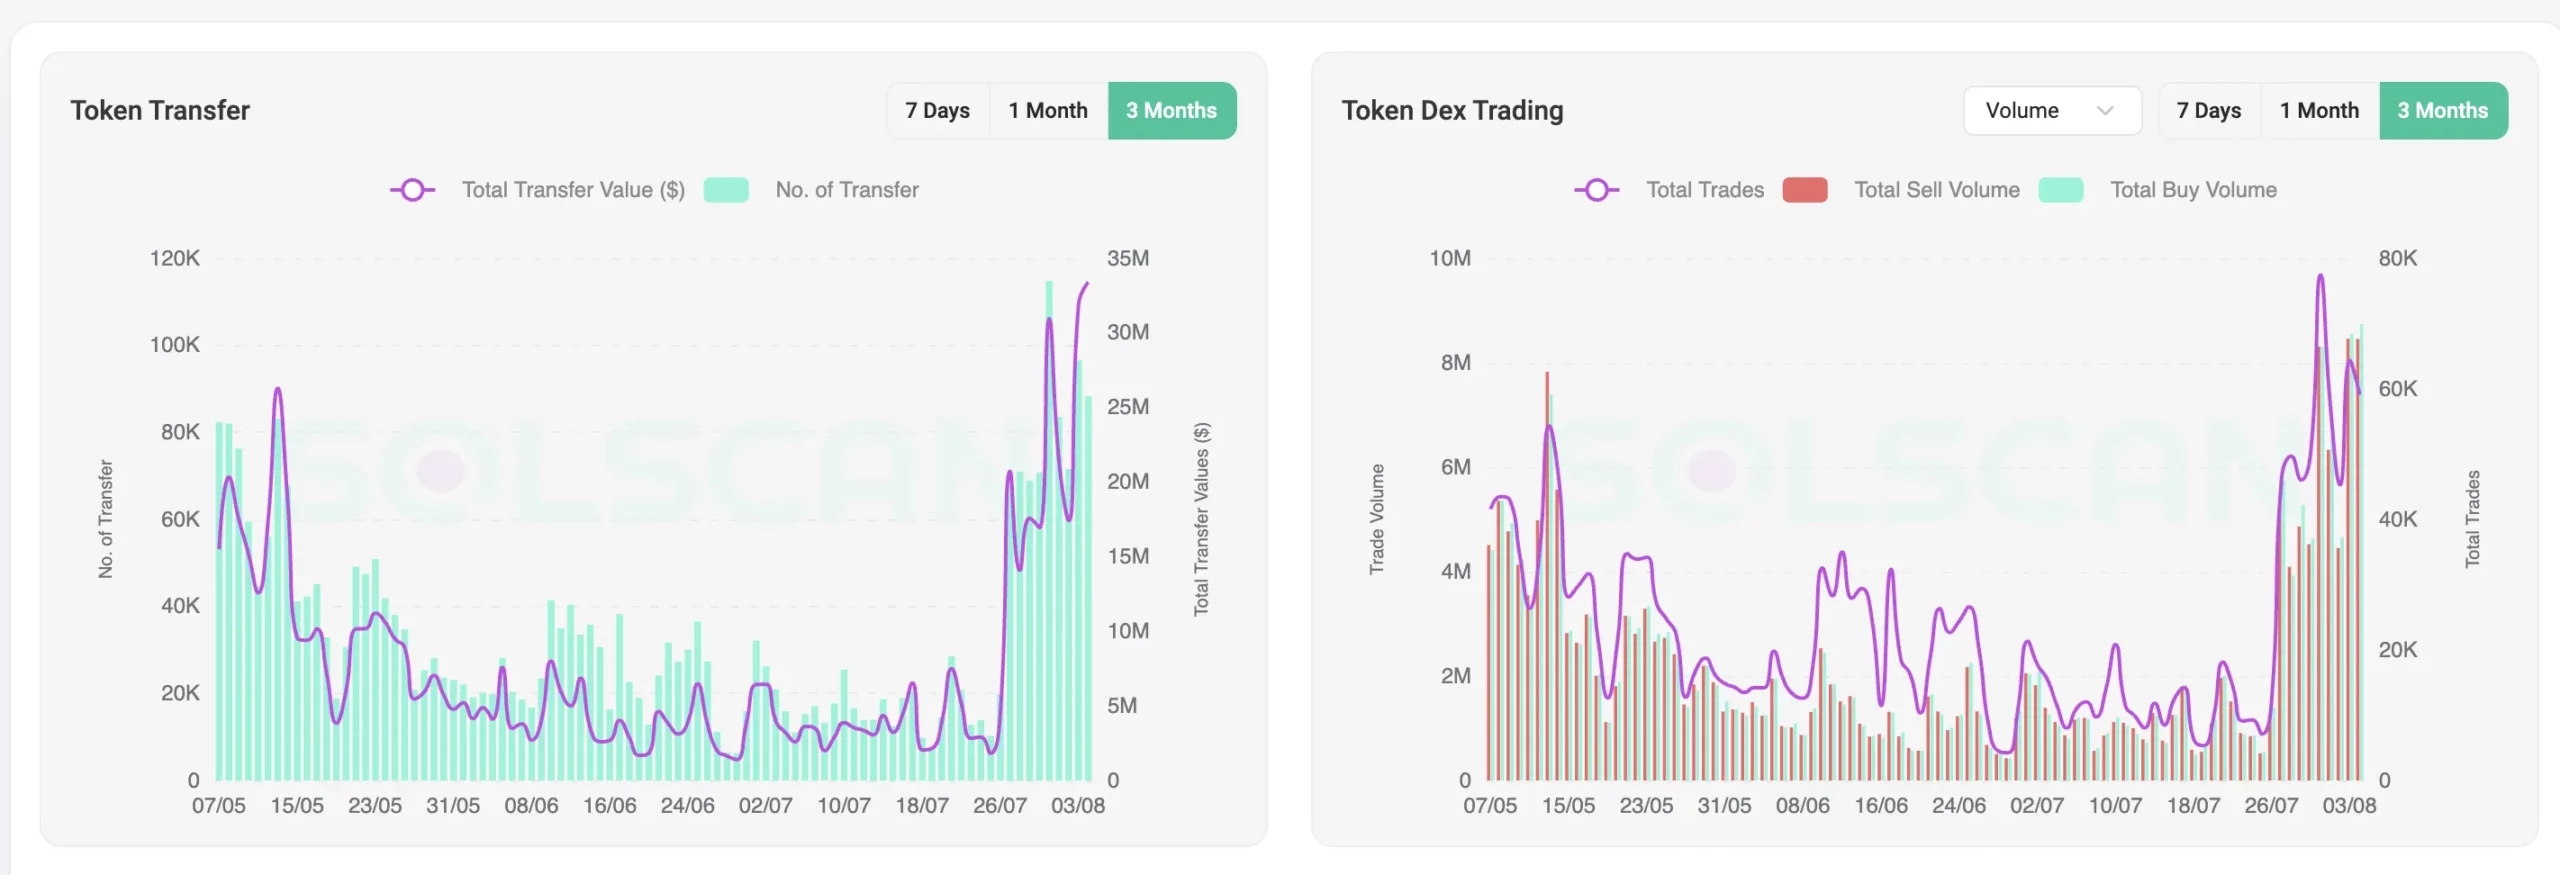
TROLL Token Trading Volume Reaches New Highs
Solscan data indicates trading volumes for the TROLL token have increased, supported by higher token transfer activity. These changes align with rising activity in the Solana meme coin market.
Dune Analytics reported steady growth in meme token launches on Solana. LetsBonk leads this segment with 60% of the market share, while Pump.Fun’s share has declined.
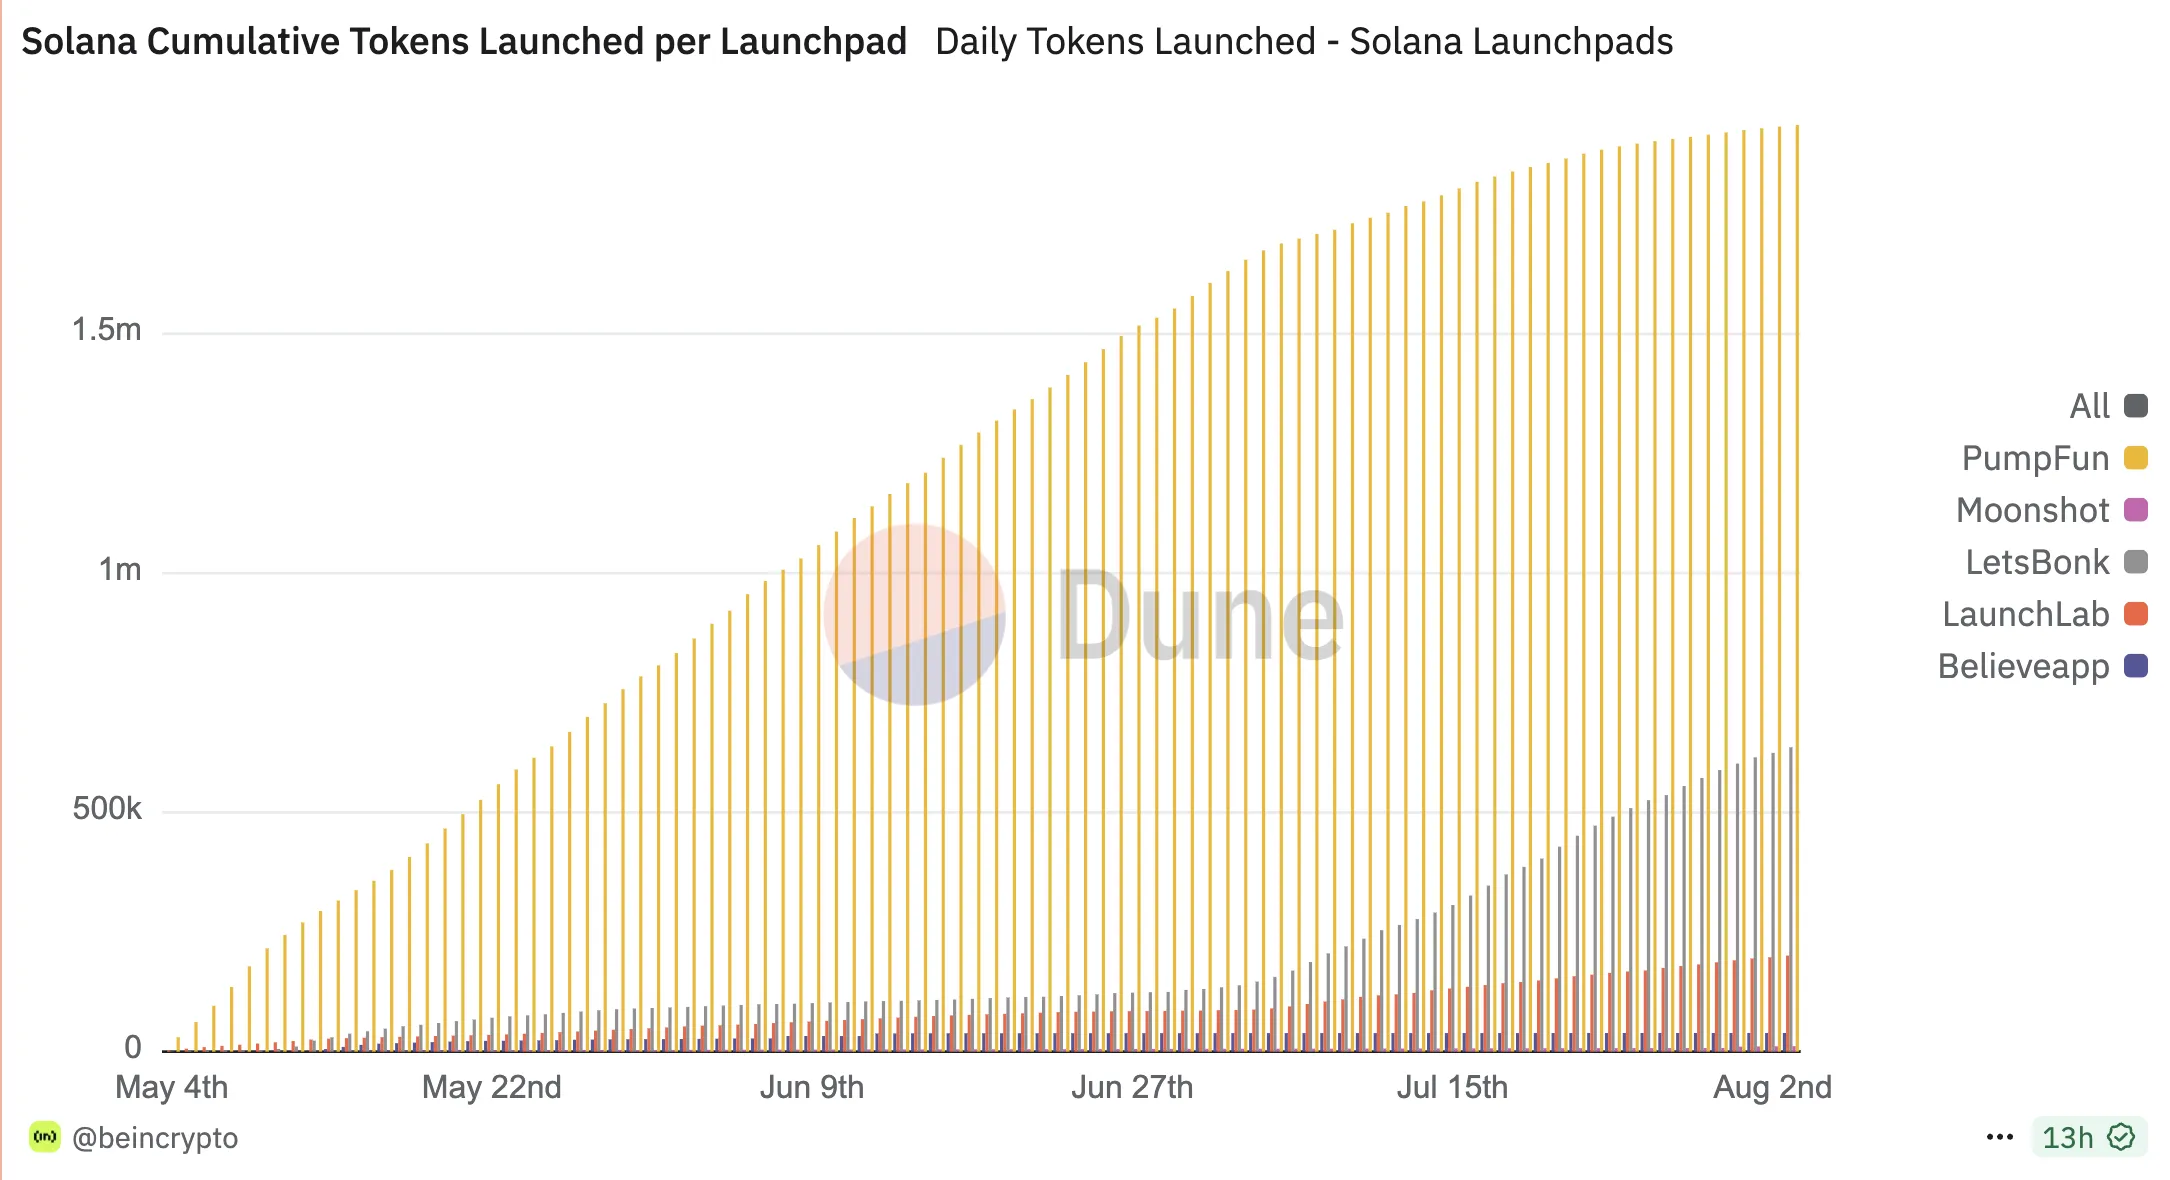
The overall meme coin market cap increased 3%, reaching $72 billion. Solana meme coin activity continues to expand, reflected in both trading data and blockchain launches.
TROLLUSDT Chart Forms Ascending Channel Pattern on August 5, 2025
The TROLL/USDTchart, created on August 5, 2025, shows that the TROLL token has formed a clear ascending channel pattern. This pattern is visible on the 4-hour KuCoin chart where the price trades between two upward-sloping parallel lines. An ascending channel represents a market structure where both highs and lows move upward, signaling sustained buying interest within defined support and resistance levels.
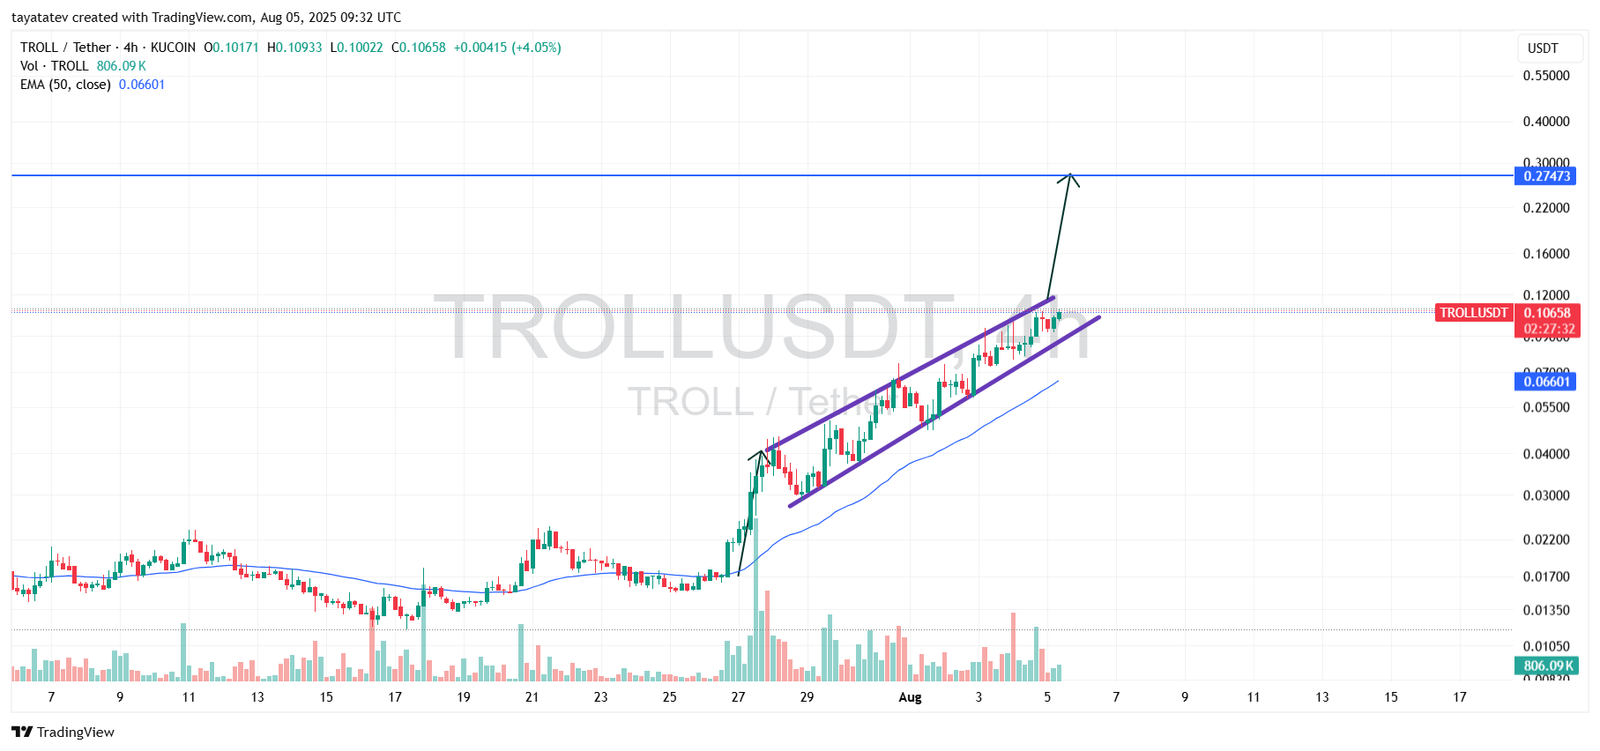
At the time of the chart, TROLL token price stood at $0.10658, with trading volume at 806,090 tokens. The 50-period Exponential Moving Average (EMA), which tracks the average price over the last 50 periods while giving more weight to recent data, is at $0.06601, acting as support below the current price.
The projection on the chart indicates that if the ascending channel holds, TROLL token price may rise by approximately 150% from the current price, potentially reaching $0.27473. This aligns with the marked resistance level shown on the chart. The structure suggests steady upward momentum supported by both higher lows and increased trading volume.
Trading activity continues to strengthen as the price moves toward the upper boundary of the channel. The consistent alignment of price with the channel’s trend lines, combined with its position above the 50 EMA, reinforces the upward bias. Additionally, the visible surge in trading volume supports this price movement, showing active participation in the market.
Overall, the ascending channel on TROLL/USDT illustrates a controlled and steady upward move. The combination of rising lows, parallel resistance levels, and a sharp increase in market volume provides technical backing for further gains if the pattern remains intact.
TROLLUSDT RSI Analysis Shows Overbought Conditions on August 5, 2025
The Relative Strength Index (RSI) chart for TROLL/USDT, created on August 5, 2025, shows an RSI value of 74.59. The RSI is a momentum oscillator that measures the speed and change of price movements on a scale from 0 to 100. Values above 70 typically indicate overbought conditions, while those below 30 suggest oversold levels.
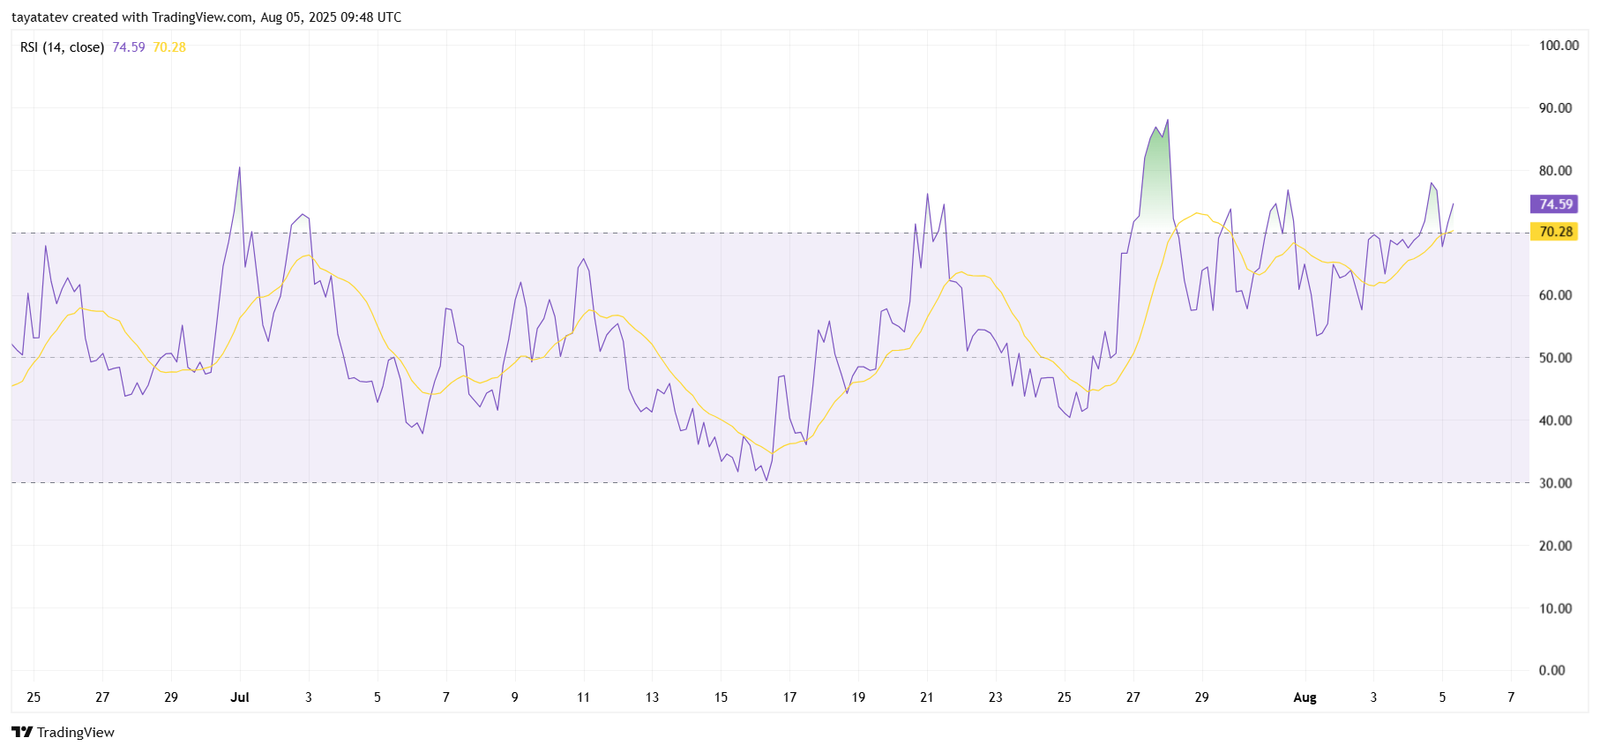
The current RSI level above 70 places the TROLL token in an overbought zone. This reflects recent strong upward price momentum. The 14-period RSI, used here, tracks average price gains and losses over the last 14 periods. The yellow moving average line for RSI is at 70.28, slightly below the RSI reading, indicating sustained bullish strength.
From late July to early August, the RSI climbed sharply, aligning with the rapid price increase seen on the price chart. The upward RSI movement corresponds with the formation of higher highs and rising volumes, confirming strong buying activity. While RSI readings above 70 highlight overbought conditions, they also indicate that the price trend has maintained significant strength.
The chart demonstrates that TROLL token momentum remains high, supported by sustained RSI readings above the neutral 50 level and a close alignment between the RSI and its moving average. This reflects steady price acceleration within the same timeframe.
TROLLUSDT MACD Analysis Indicates Strong Momentum on August 5, 2025
The Moving Average Convergence Divergence (MACD) chart for TROLL/USDT, created on August 5, 2025, shows clear upward momentum. The MACD uses two lines: the MACD line (blue) and the signal line (orange). These are based on the 12-period and 26-period exponential moving averages (EMAs). The histogram represents the difference between these lines.
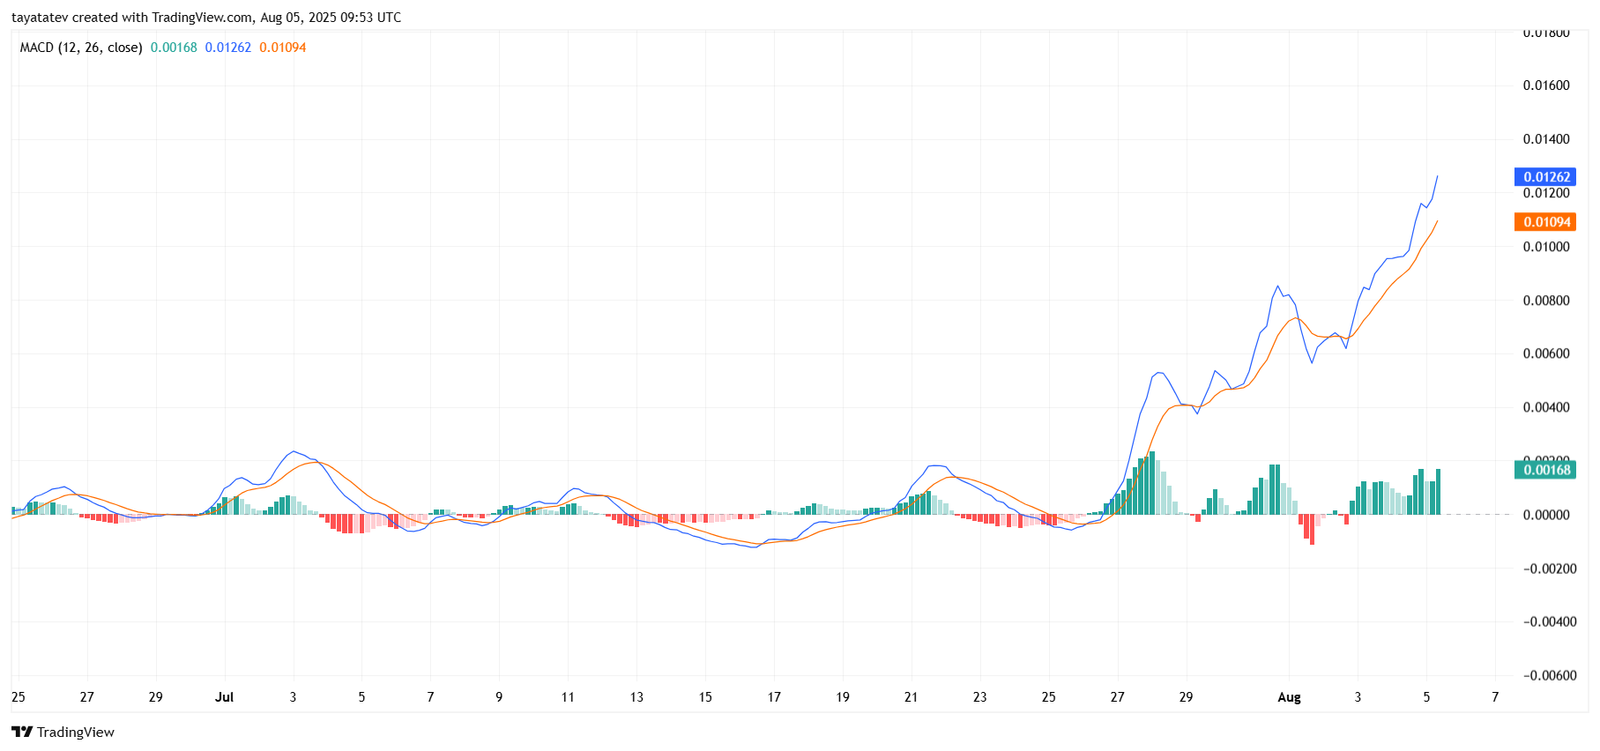
On this chart, the MACD line is at 0.01262, above the signal line at 0.01094, reflecting positive momentum. The histogram bars are green and rising, showing strong bullish activity. The MACD crossing above the signal line in late July aligns with TROLL’s recent price rally.
Additionally, the distance between the two lines has widened, which indicates accelerating momentum. Sustained green histogram bars further confirm this strength. The steady rise of both lines mirrors the recent price action, supported by increasing trading activity.
The MACD level remaining above zero reinforces ongoing upward movement. This signals that recent price averages are trending higher than longer-term averages. The alignment of these indicators suggests that bullish momentum has persisted into early August, supported by higher trading volumes and consistent price gains.
