
The Network Value to Transactions (NVT) ratio for Tron (TRX) has surged to its highest level in six weeks. This metric compares a network’s market capitalization to its transaction volume.
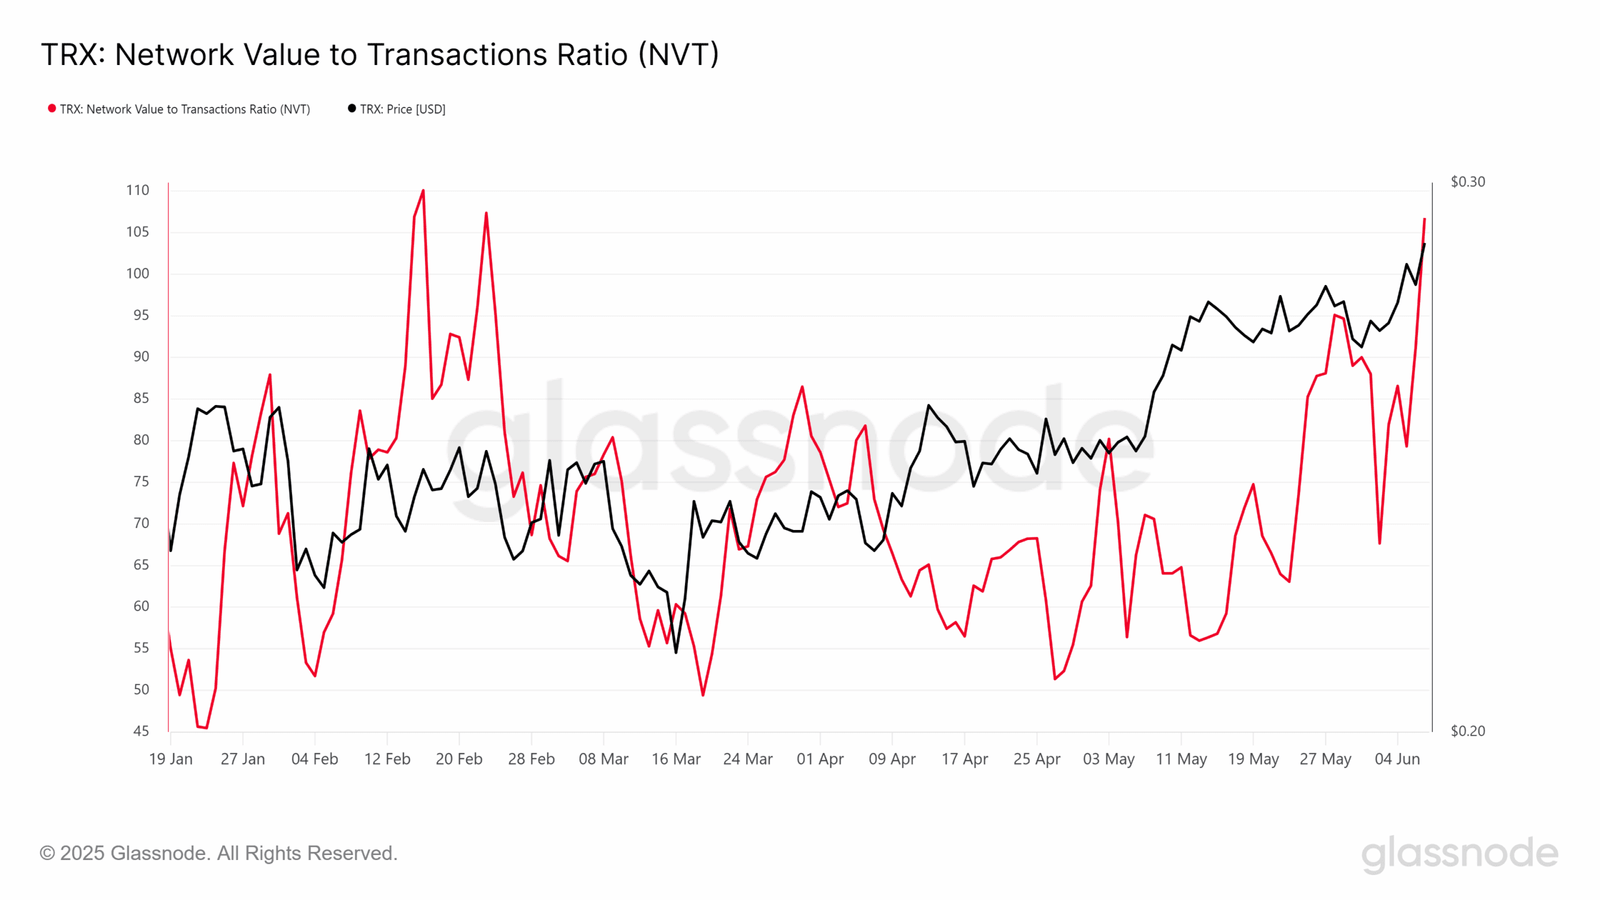
When the NVT ratio rises, it usually indicates that the network’s market value is growing faster than its actual usage. This imbalance often points to potential overvaluation. In TRX’s case, the spike in NVT could signal investor caution ahead.
As TRX’s NVT climbs, downward price pressure may follow. Investors may reassess their positions, especially if sentiment shifts. A higher NVT typically implies fewer transactions relative to market cap, which can lead to a sell-off if confidence weakens.
While a price correction now looks increasingly likely, strong on-chain data shows key support. According to IntoTheBlock’s IOMAP indicator, there is a large demand zone between $0.268 and $0.276. Roughly 13.89 billion TRX—valued close to $4 billion—was accumulated in this range.
This concentration of buyer interest forms a solid price floor. Investors who entered at these levels are unlikely to sell without profit, which reduces the risk of a sharp price drop.
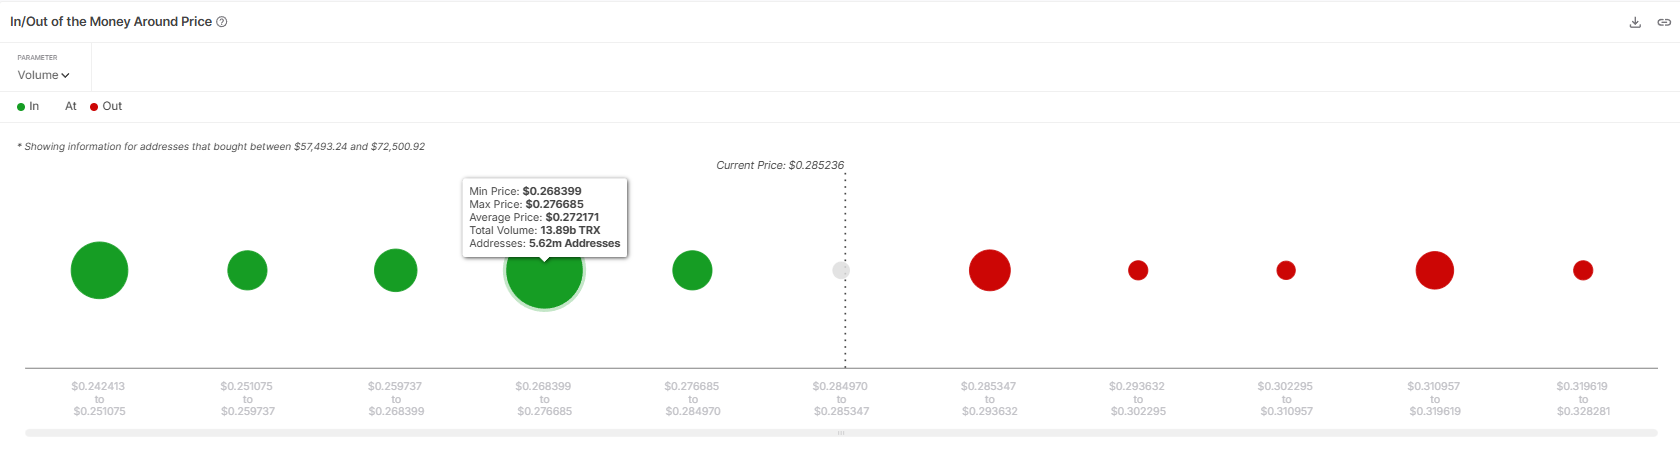
Even if TRX corrects, the token is expected to find support above $0.276. The high-volume demand zone should help stabilize prices during any near-term market pullback.
TRON Forms Ascending Channel, Targets 14% Price Surge
On June 9, 2025, the TRX/USDT 4-hour chart on Binance created an ascending channel pattern.
An ascending channel is a bullish chart pattern formed by two parallel upward-sloping trendlines that connect higher highs and higher lows, signaling consistent price appreciation.
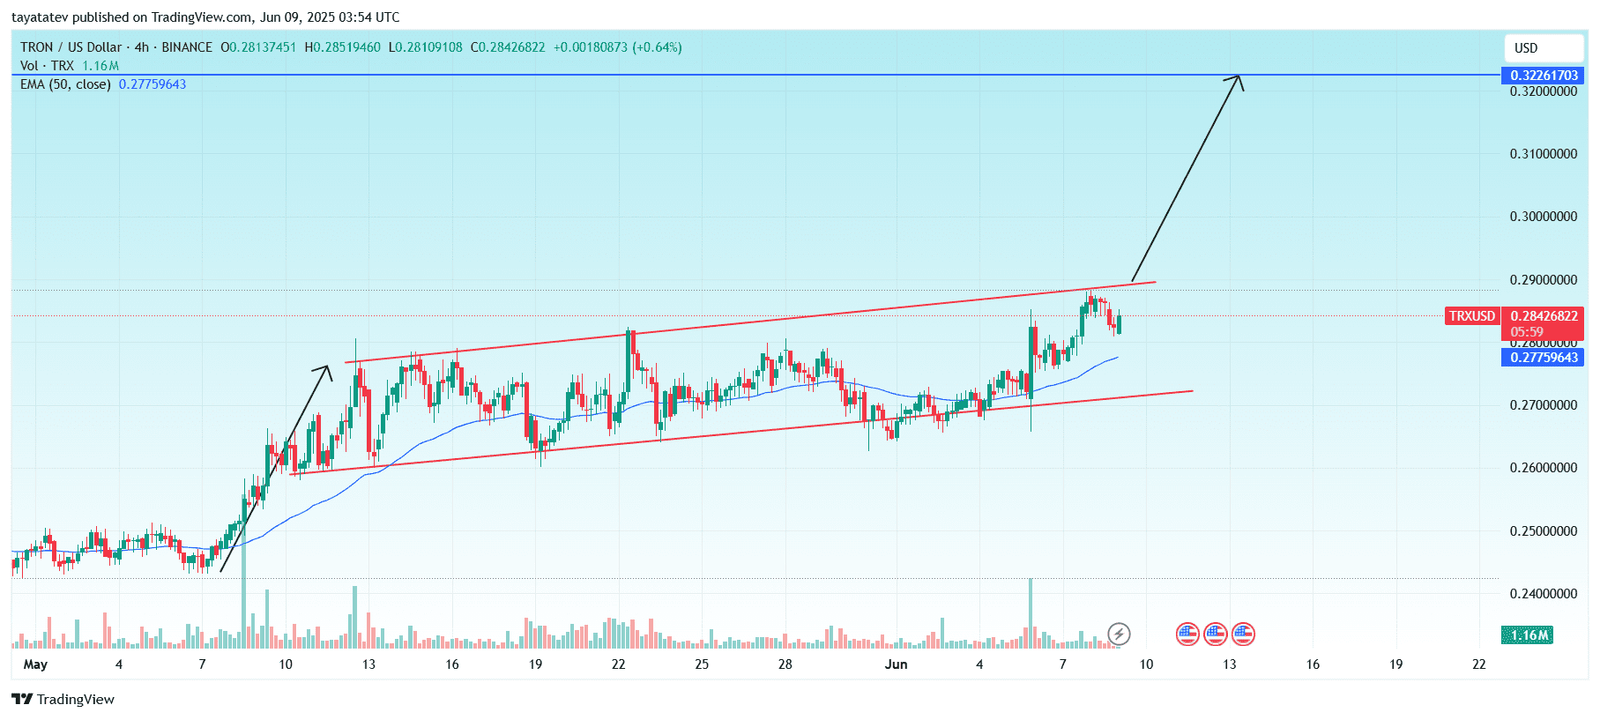
If this breakout confirms, the TRX price could rise 14% from the current level of $0.2842 to the projected target near $0.3226.
The chart shows TRON respecting both trendlines since early May. After retesting the lower boundary around $0.268, TRX bounced and now trades above the 50-period Exponential Moving Average (EMA), currently at $0.2776. This dynamic support line strengthens the bullish setup.
Volume remains steady, while recent green candles suggest renewed buyer interest. A breakout above the upper channel resistance, around $0.29, would likely trigger upward momentum toward the $0.3226 resistance level.
If TRX breaks out with volume support, the ascending channel may lead to a fresh rally, especially as market structure remains bullish.
TRX RSI Holds Bullish Momentum Above 60
The 4-hour Relative Strength Index (RSI) for TRX/USDT shows a reading of 62.36, staying above the neutral 50 level.
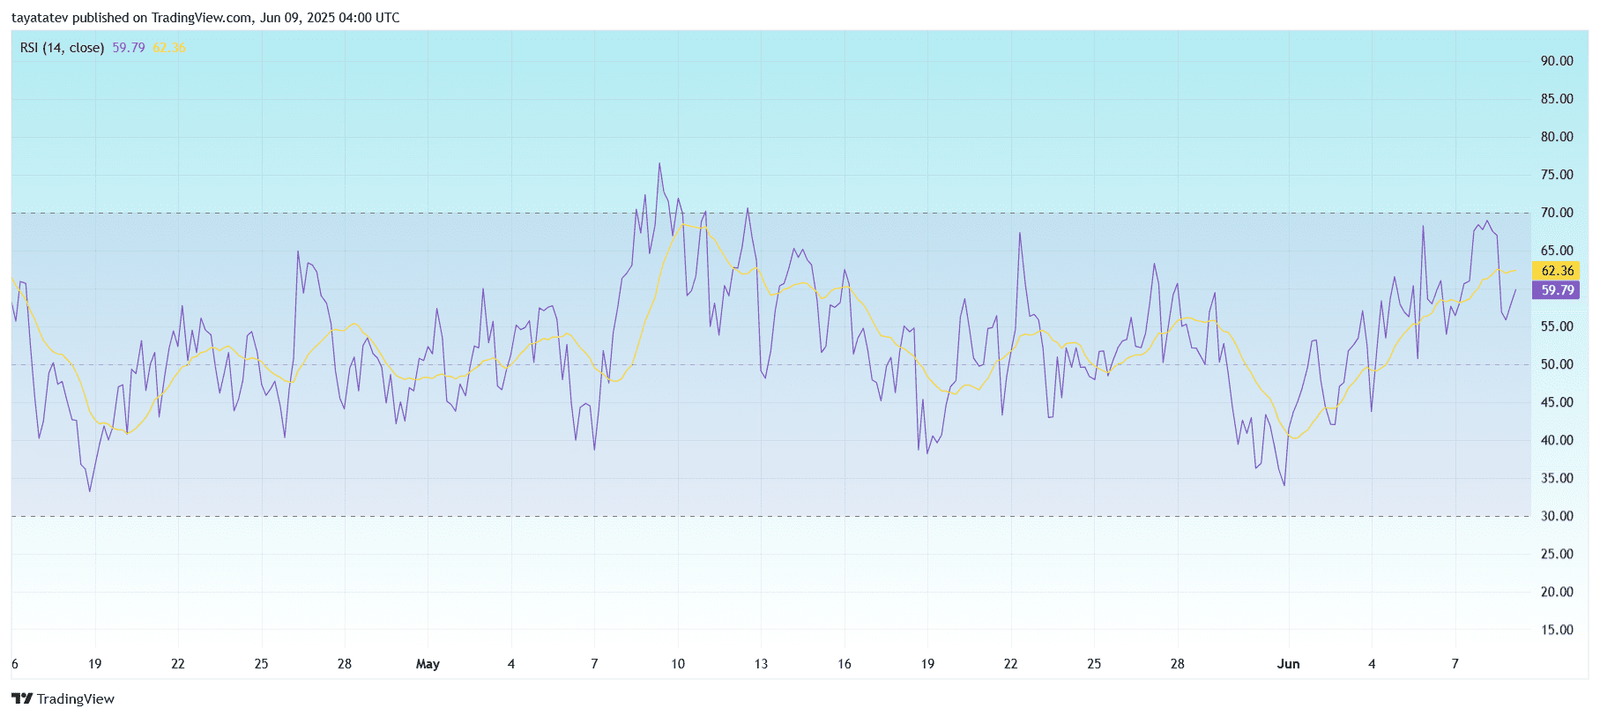
The RSI is a momentum oscillator that measures the speed and change of price movements, typically on a scale from 0 to 100. Readings above 70 suggest overbought conditions, while readings below 30 indicate oversold levels.
Currently, TRX’s RSI line continues to trend upward, supported by the 14-period Simple Moving Average (SMA) at 59.79. This crossover confirms bullish strength and steady buying pressure. Since mid-May, RSI has maintained a consistent rise, bouncing off lows near 30 and gradually climbing into the bullish zone.
As long as RSI stays above 60, TRX is likely to sustain momentum. If the oscillator pushes closer to 70, the market could approach overbought territory. However, no divergence or reversal signal is visible, suggesting the uptrend may continue in the near term.
Tron DMI Signals Bullish Momentum Strengthening
On June 9, 2025, the 4-hour chart for TRX/USDT showed a clear directional strength shift using the Directional Movement Index (DMI).
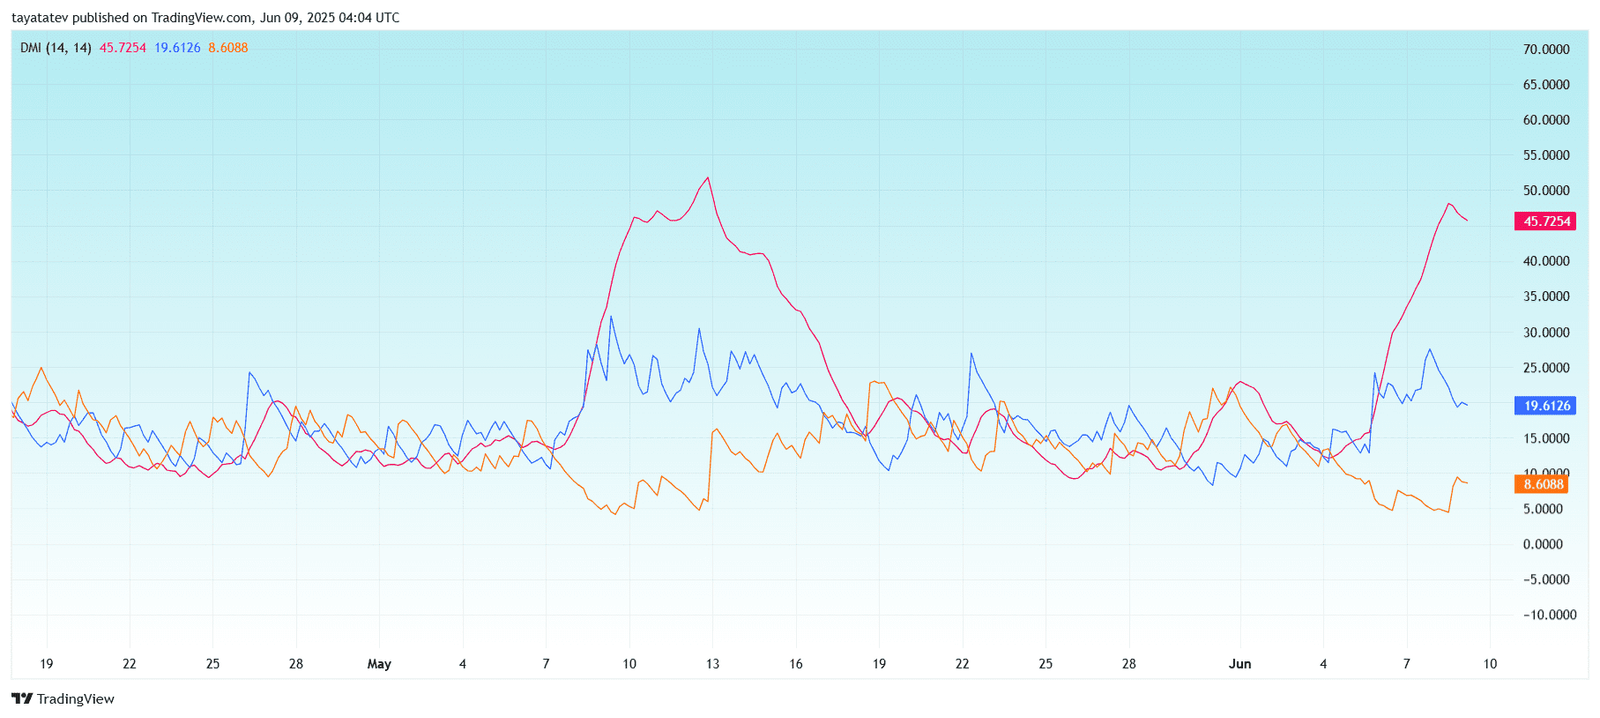
The DMI indicator consists of three lines:
+DI (blue): measures bullish strength
−DI (orange): measures bearish strength
ADX (red): measures overall trend strength
At the time of the chart, the +DI is at 19.61, the −DI is at 8.60, and the ADX is at 45.72. A rising ADX above 25 confirms a strong trend, and in this case, it signals strengthening bullish momentum.
Since early June, the +DI line has remained above the −DI line, showing buyers are in control. As the ADX sharply rises above 40, the chart confirms that the uptrend is gaining traction. The widening gap between the +DI and −DI lines further validates this upward pressure.
As long as the ADX remains elevated and the +DI stays dominant, TRX is likely to extend its upward trend. No bearish crossover is visible, keeping the bias positive.
TRX MACD Shows Fading Bullish Momentum on June 9
Meanwhile, he 4-hour chart for TRX/USDT reveals key signals from the Moving Average Convergence Divergence (MACD) indicator.
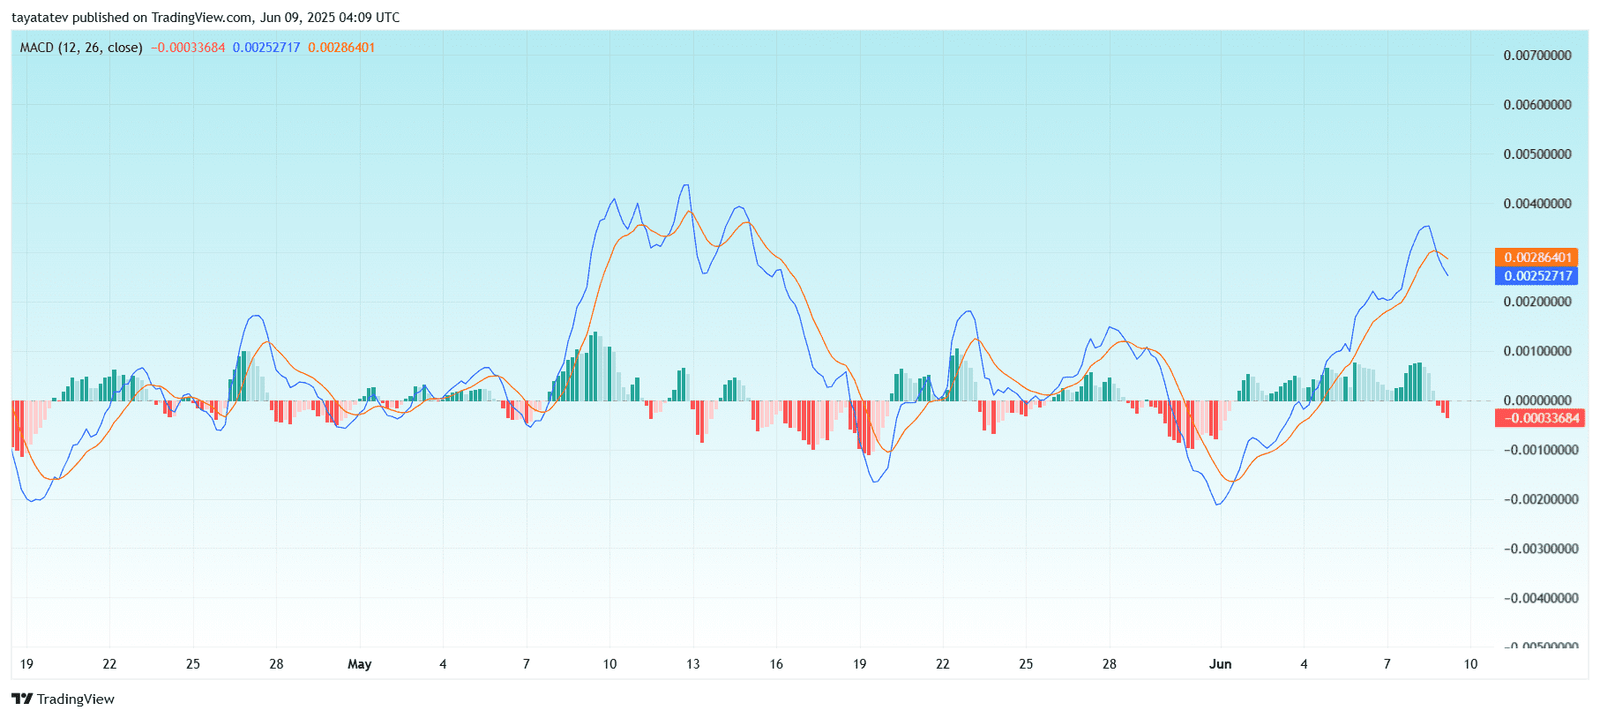
The MACD consists of two lines:
MACD Line (blue): difference between the 12-period and 26-period exponential moving averages
Signal Line (orange): 9-period exponential moving average of the MACD line
The histogram visualizes the difference between these two lines
At the time of the chart, the MACD line stands at 0.0025, while the signal line is at 0.0028. The histogram shows a slight negative value of −0.0003, indicating a minor bearish crossover.
This crossover signals that bullish momentum may be slowing. After a strong rally in early June, the MACD lines have flattened, and the histogram has turned red. Although the current signal is not strongly bearish, it does suggest weakening upside momentum.
However, the MACD remains near positive territory, meaning Tron is not yet in a clear downtrend. Traders may wait for further confirmation before acting, especially if the MACD line dips deeper below the signal line.
