
Uniswap (UNI) is showing unexpected strength after months of sideways trading. Once seen as a laggard in the altcoin market, the token has bounced sharply off its long-term support. Charts from multiple analysts now show a tightening structure and a potential multi-month breakout setup forming.
UNI Finds Strong Support, Bullish Momentum Builds
On June 18, @UniChartz shared a 4-hour UNI/USDT chart showing the token trading above a major support zone. The price hovered around $7.55, just above the 100-period EMA at $7.13. A clear descending trendline has kept UNI under pressure, but the Stochastic RSI shows a bounce from oversold territory.
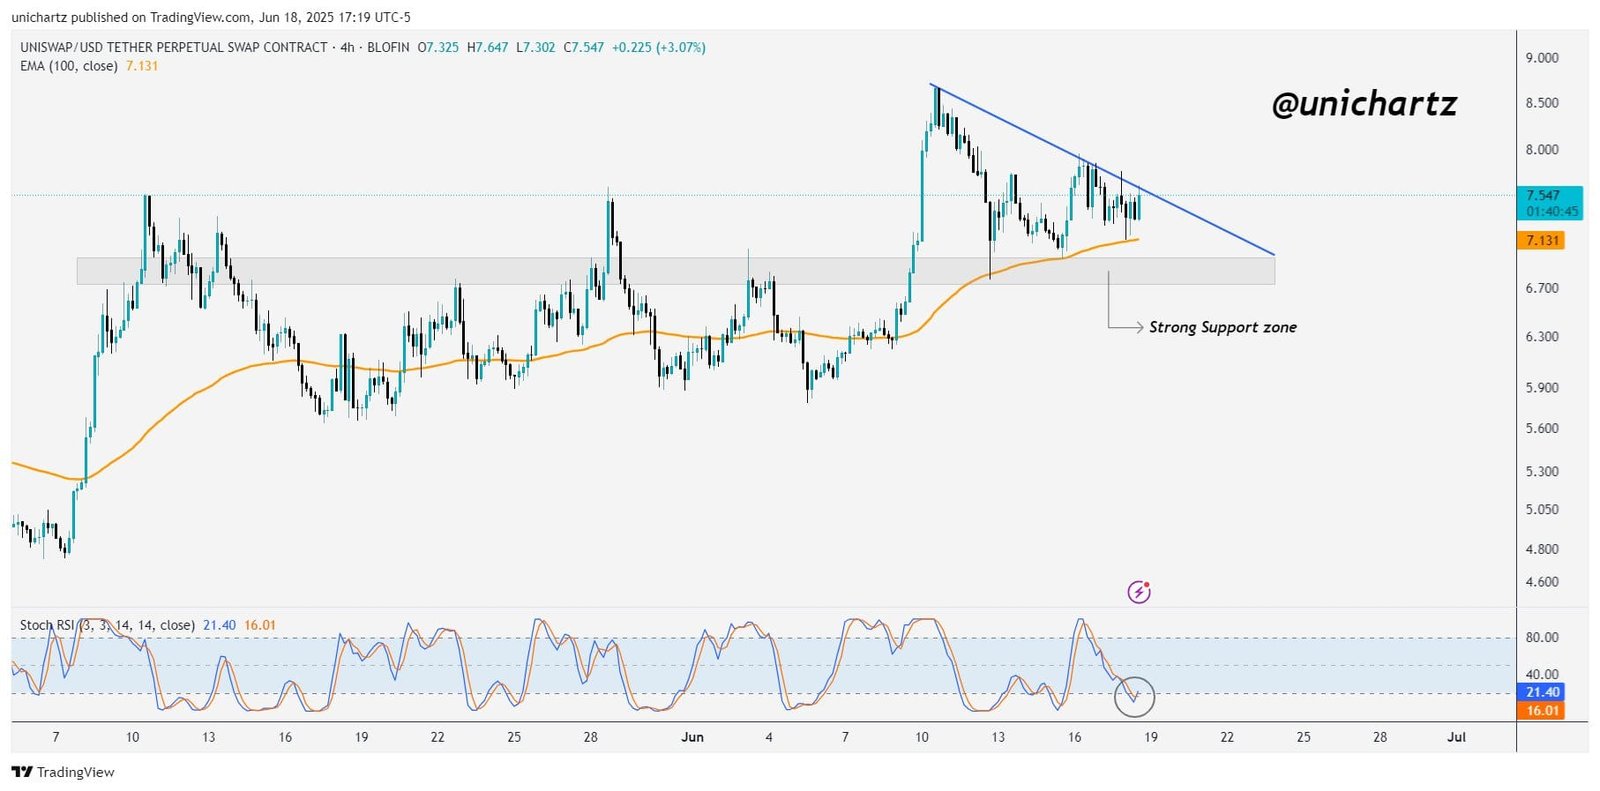
“$UNI is sitting right above a strong support zone… Stoch RSI is trying to bounce from oversold, which could hint at a breakout,”
UniChartz wrote.
This narrowing range signals price compression. If bulls manage to break above the descending trendline, a fast rally could follow. The structure resembles a classic bullish continuation setup. However, a failure to hold the 100 EMA or the horizontal support zone could invalidate the pattern.
Weekly Chart Shows Room for Explosive Rally
A separate weekly chart shared by @CryptoPatel on June 11 shows a broader bullish setup. UNI has bounced off its long-term ascending support trendline and reclaimed levels above $8. Patel believes a breakout above the “1st Breaker” zone around $10.35 could unlock major upside.
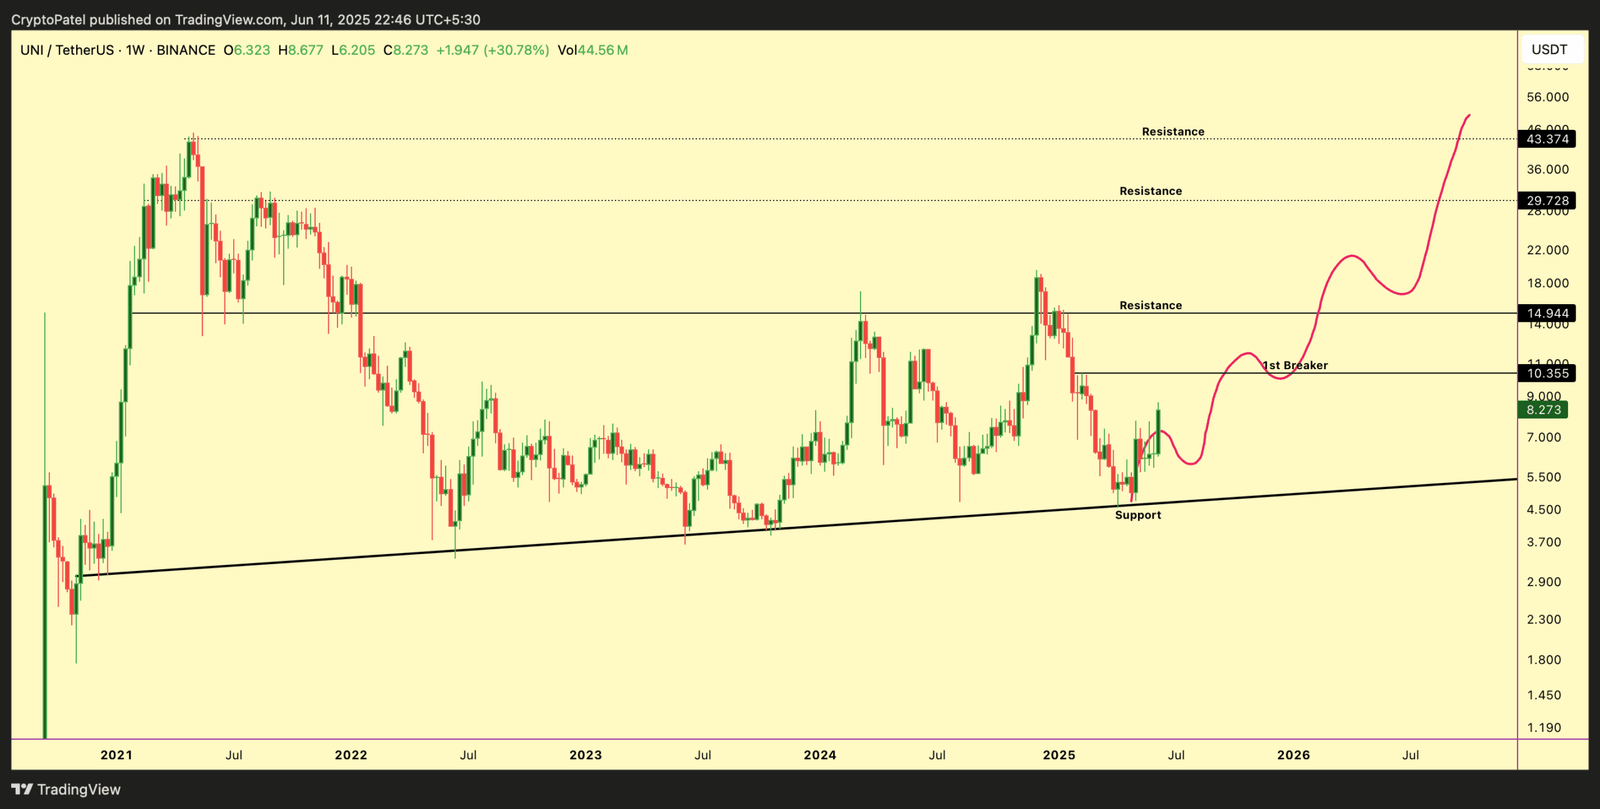
“#UNI is bouncing hard from support & eyeing the 1st breaker zone at $10.35 — a weekly close above this can trigger a MAJOR RALLY!”
CryptoPatel wrote.
The projected targets for Uniswap (UNI) now stand at $15, $29, and potentially above $43. Specifically, the chart highlights three key resistance levels: $14.94, $29.72, and $43.37. These levels represent major barriers that could define the token’s path over the coming months.
Meanwhile, the weekly chart outlines a consolidation phase that has lasted for over two years. A decisive weekly close above $10.35 would likely confirm a breakout from this prolonged range. Such a move could shift market sentiment and attract fresh momentum.
Until that happens, traders remain focused on two critical areas. First, the descending trendline on the short-term chart continues to act as local resistance. Second, the $10.35 threshold now serves as the key trigger point for a multi-month breakout. If UNI pushes past both, the recovery phase may finally begin
