
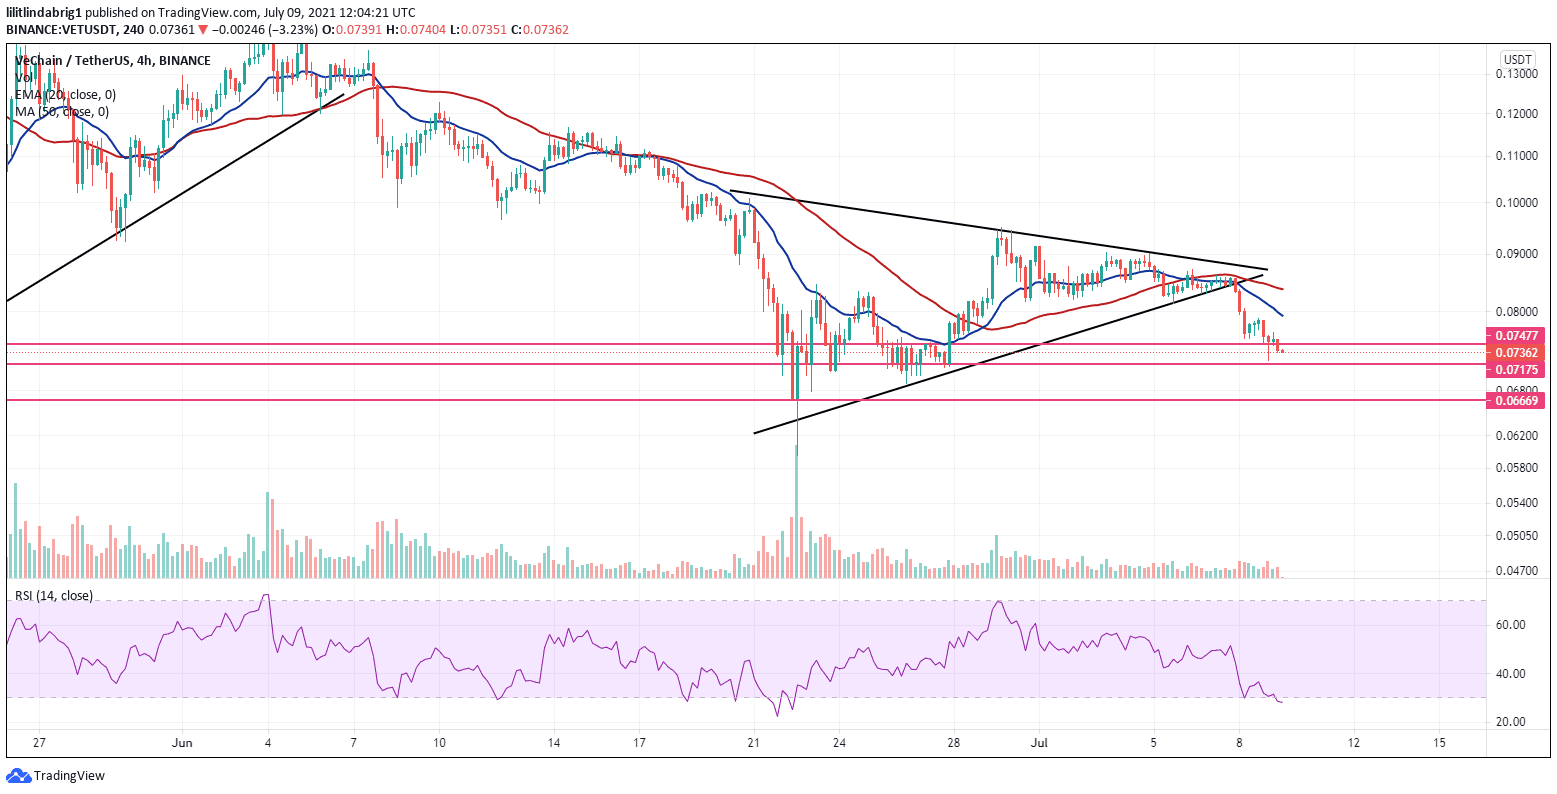
- VeChain’s daily chart with a bearish symmetrical triangle
- Possible bullish indicators
YEREVAN (CoinChapter.com) – VeChain Thor public blockchain’s native token VET plunged 14 percent in the past two sessions, reaching 0.073 USDT in the Friday session and crowning the week-to-date loss of 12 percent. The token also registered a bearish setup on the charts that could lead to further declines.
VeChain’s bearish setup
VET formed a bearish symmetrical triangle pattern on the chart against Tether USD Stablecoin (USDT). The formation consisted of two converging trendlines with similar slopes, binding the price action. The upper trendline capped the upward attempts and the lower trendline prevented sharp declines.
The symmetrical triangle is a continuation pattern. Once the formation is complete, the token could adopt the bias preceding the triangle, which was bearish. Moreover, the following trend could take the token lower by as much as the distance between trendlines at the beginning of the formation. If the prediction pans out, VET could eye a level of approximately 0.057USDT, or 22 percent lower than the current price of 0.073USDT.
VeChain exhausted the pattern on July 8. It plunged right past the support/resistance at 0.074USDT, complying with the bearish prediction. There are two more significant support lines ahead to retest at 0.071 and 0.066 USDT.
Also read: Dogecoin jumps 21 percent on Elon Musk’s Twitter promotion
Bullish signs?
Despite the overwhelming bearish outlook, there are two positive trends for VeChain. Trade volumes on the daily chart have been low for over a week. Trade volumes, the green/red columns at the bottom of the chart, indicate the number of trades over a specific date. Low trade volumes show a strong holding incentive among traders.
Moreover, the Relative Strength Index (RSI) stood at the bottom of the purple range, at approximately 30. In hindsight, the RSI reflects the attitude of the traders towards the momentum of a token or stock. When the RSI is below the 30-70 range, traders consider it oversold and buy the dip, sending the price up. In reverse, when the RSI shoots above 70, traders consider it overbought, pulling their bids and lowering the price to avoid losses.
Also read: German institutional investors can now invest in bitcoin and crypto markets
Low RSI is a bullish hint. However, it likely won’t be enough to overpower the bearish incentive. The VeChain token already exhausted the symmetrical triangle continuation pattern. VET lost 14 percent since then, continuing the descent.

… [Trackback]
[…] There you can find 46724 more Information on that Topic: coinchapter.com/vechain-flashes-extremely-bearish-setup-as-vet-plunges-12-wtd/ […]