
VIC/USDT recorded a massive 125.17% price jump between July 1 and July 7, 2025, rallying from $0.1578 to an intraday peak of $0.3554. The breakout occurred over six consecutive green daily candles, supported by soaring volume and a confirmed break above key resistance levels.
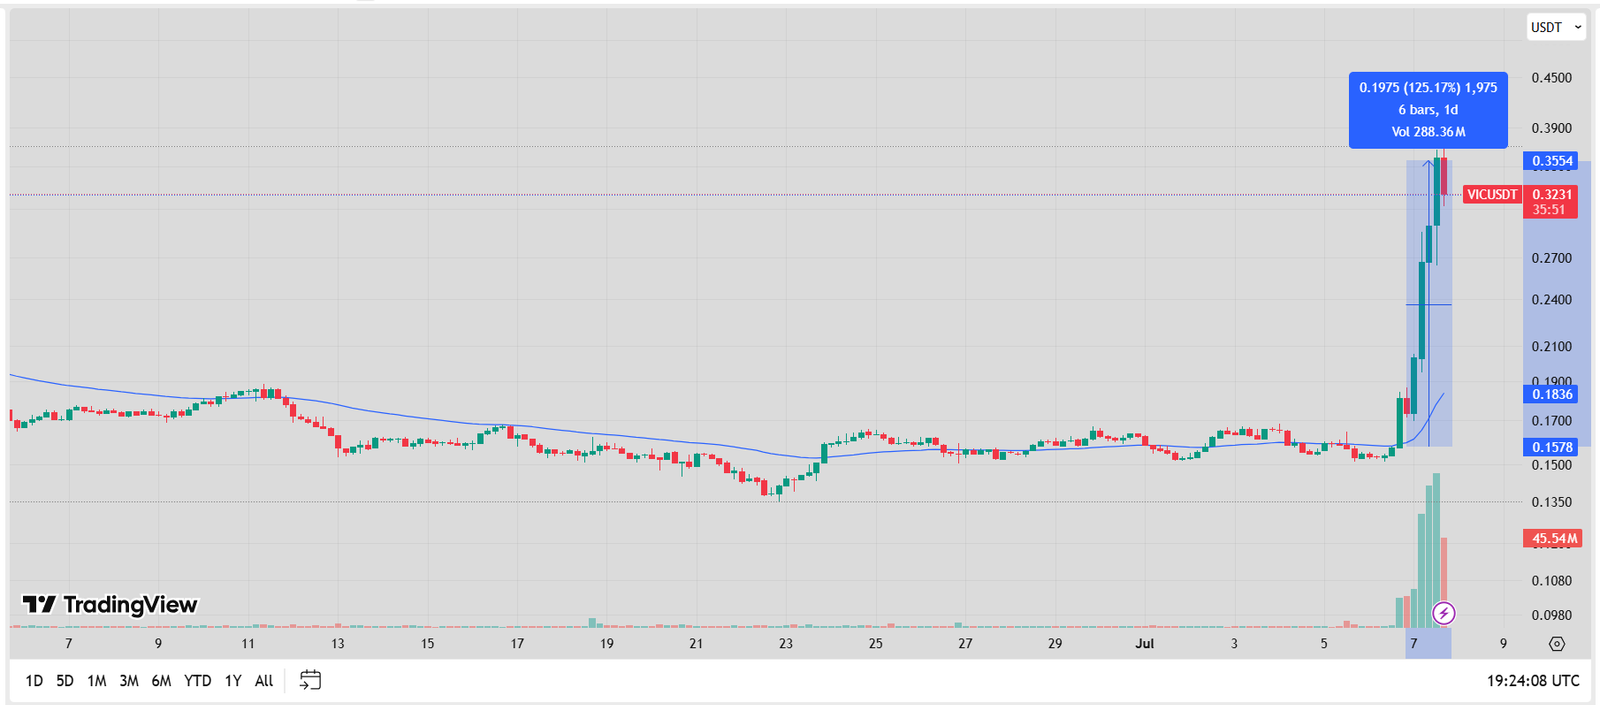
According to TradingView data, VIC’s daily trading volume spiked to 288.36 million, with the largest single-day volume at 45.54 million on July 7. This surge in volume confirms strong buying pressure and signals widespread market participation in the move.
During the rally, VIC decisively broke above its 50-day Exponential Moving Average (EMA), which was acting as resistance around $0.1836. Once breached, the price accelerated sharply, pulling in even more buyers.
Key Resistance Turned Support
The chart now shows that the $0.27–$0.29 zone—previously resistance—may serve as the first support area if VIC attempts a retest. As of the last candle, VIC trades at $0.3231, slightly below the recent high but still firmly above the short-term EMA and breakout zone.
Traders are now watching whether VIC can consolidate above $0.30 or continue toward psychological resistance near $0.40. However, the parabolic nature of the move may attract short-term profit-taking.
With strong volume and sustained momentum, VIC has positioned itself as one of the top performers in early July. If bulls maintain control above the breakout zone, continuation remains possible—though high volatility should be expected following such a rapid move.
VIC RSI Hits 79.22, Signals Overbought Zone After Explosive Price Rally
On July 7, 2025, the Relative Strength Index (RSI) on the VIC/USDT daily chart soared to 79.22, placing the token deep in overbought territory. The RSI, a momentum oscillator using a 14-day average, generally indicates overextension when values exceed 70.
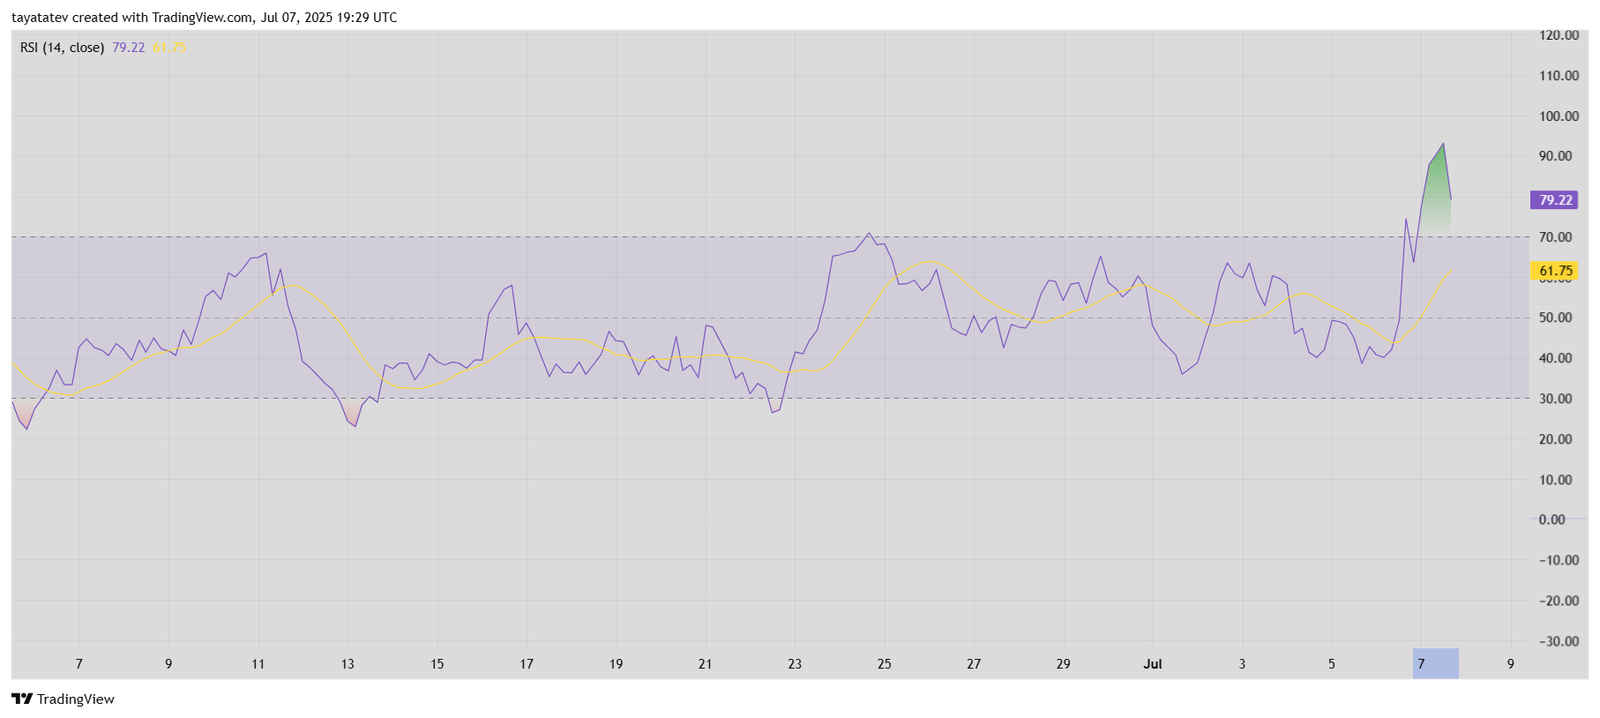
In this case, the RSI spiked after VIC’s 125% breakout over the last six days. The sharp rise in price was mirrored by a steep RSI surge, confirming intense bullish momentum. The RSI line also crossed above its signal average of 61.75, reinforcing the strength of the move.
However, historically, RSI levels above 70 suggest a potential pullback or cooling phase, especially if profit-taking begins. The RSI may remain overbought during strong uptrends, but traders typically monitor for a dip below 70 as an early sign of correction.
