
HyperLiquid came under scrutiny after blockchain analytics firm SpotOnChain flagged suspicious trading activity. A group of large wallets allegedly coordinated trades that pushed the token’s value nearly 200% higher to $1.80 before it quickly dropped back.
According to the data, one orchestrator booked more than $15 million in profits, while three others gained between $9 million and $13 million each. Traders on the opposite side of the move reportedly lost over $6.5 million.
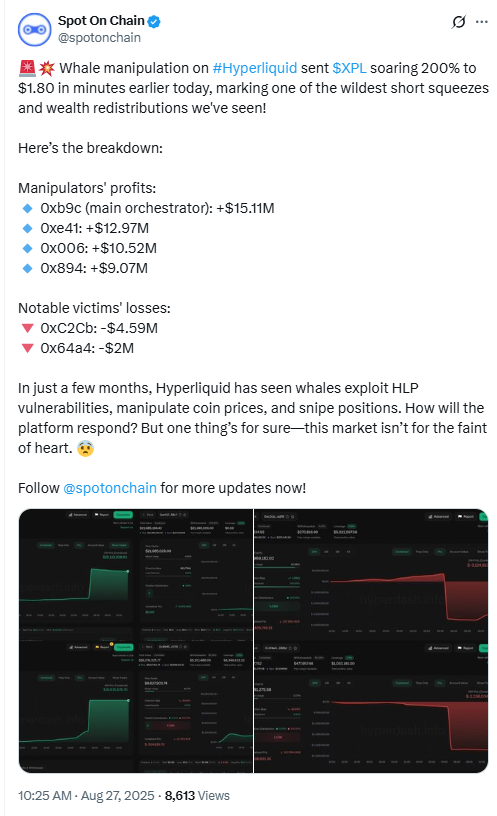
The episode revived concerns over market manipulation in smaller digital asset ecosystems, where concentrated positions often drive sharp volatility. Regulators and market observers are closely watching the fallout.
BitGo Adds Custody for HyperLiquid
Away from the trading controversy, HyperLiquid secured a key step toward institutional adoption. BitGo, a leading digital asset custodian, announced support for the HYPE token. The integration provides both standardized custody and self-custody solutions.
The move enables hedge funds, asset managers, and other institutions to gain exposure through regulated custody infrastructure. BitGo’s wallet and compliance tools are widely used across the digital asset industry, making the listing a notable milestone for HyperLiquid.
Institutional Entry Gains Momentum
With BitGo support in place, analysts note that HyperLiquid is positioned to attract larger pools of capital. Custody remains one of the biggest barriers for institutions entering new digital assets, and BitGo’s endorsement addresses that gap.
Industry participants view the development as part of a broader trend of mid-tier crypto projects seeking credibility through partnerships with established custodians. While the whale trading allegations highlight risks, institutional infrastructure may help balance liquidity and oversight.
The combination of whale manipulation claims and BitGo’s custody listing highlights the challenges and opportunities facing HyperLiquid. On one hand, concentrated trading activity raises doubts about market fairness. On the other, expanded custody access signals growing institutional interest.
The outcome will depend on whether HyperLiquid can stabilize its ecosystem while maintaining momentum with traditional finance partners.
HyperLiquid daily chart analysis, created Aug 27, 2025
The TradingView screenshot shows HYPEHUSD on the one day timeframe moving inside a rising channel. Price closed at 50.15 with a 50 day EMA at 42.89, so price trades above trend support and the slope of the EMA points up, which confirms bullish momentum on this timeframe. The channel boundaries you drew sit roughly in the mid 40s for support and low 50s for resistance, and price is currently testing the upper rail.
An ascending channel is a pattern where price makes higher highs and higher lows between two parallel upward lines. Because the data vendor does not provide volume for this symbol on the chart, the setup lacks volume confirmation, therefore we cannot verify accumulation or distribution from this image alone.
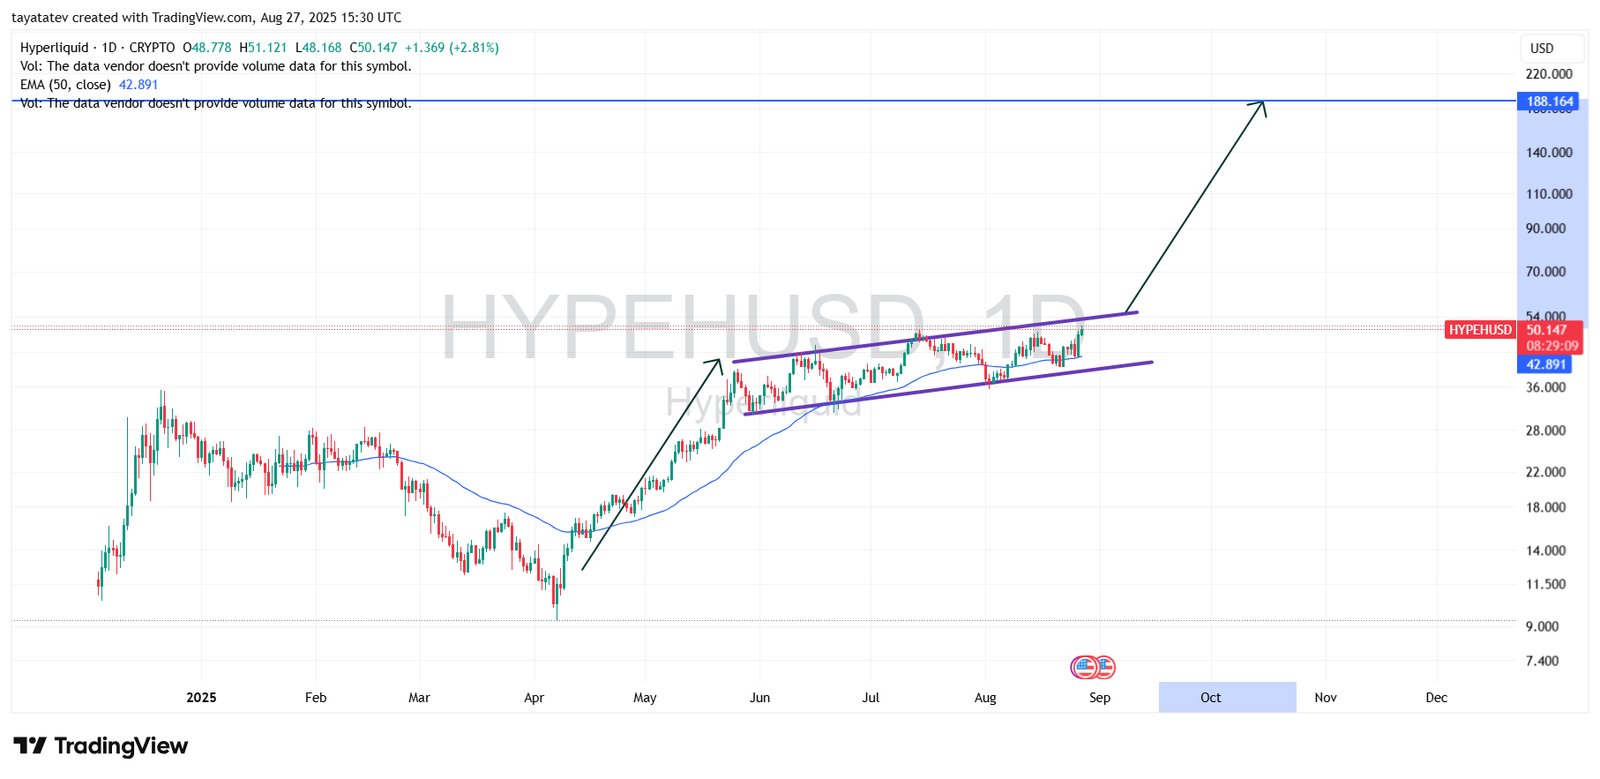
Your annotation places a horizontal target near 188.16. From the current close at 50.15, that target implies about a 275 percent advance. A strict 279 percent advance from 50.15 would project to about 190.06. The rising channel itself does not confirm a move of that magnitude. Classically, a confirmed breakout above the upper rail carries a measured objective roughly equal to the channel width added to the breakout level, which would set a nearer objective well below 188.16 on this drawing. However, the structure does confirm trend strength while price holds above the 50 day EMA and the lower rail. If price breaks and holds above the upper boundary with supportive volume, the path of least resistance remains higher and interim resistance would first be the recent channel top, then any prior horizontal levels you track. As long as price respects the channel and the EMA, the trend bias stays up on the daily chart, yet the 279 percent objective requires drivers beyond what this single pattern validates.
HyperLiquid RSI chart analysis, created Aug 27, 2025
The chart shows the 14-day Relative Strength Index for HYPEHUSD with the RSI line in purple and a moving average of RSI in yellow. Current RSI prints 61.02, while the signal line reads 53.89. Because RSI sits above 50 and slopes upward, momentum is positive and buyers control near-term direction.
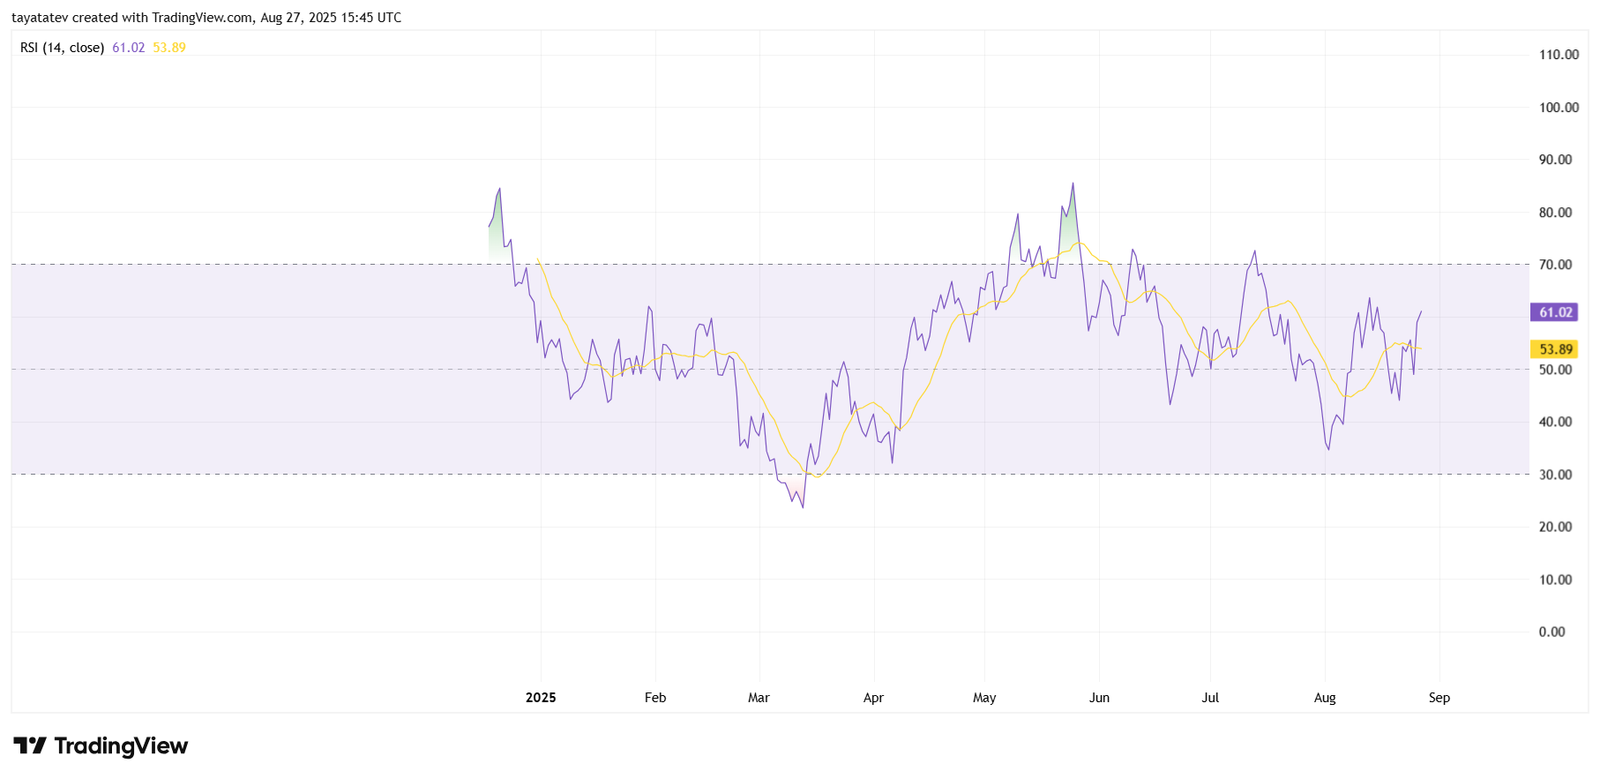
Earlier in the year, RSI dipped as low as the 30 level, which marked oversold territory. Since then, repeated rebounds kept the oscillator between 40 and 70, suggesting a steady recovery trend. Each time RSI crossed its signal line from below, price followed with upward acceleration. The latest crossover in August placed RSI back above its average, which adds confirmation of renewed strength.
An RSI level of 61 does not yet indicate overbought conditions, since that threshold usually begins at 70. Instead, it signals constructive momentum with further room for upside before the market risks exhaustion. As long as RSI holds above the midline and continues to track higher than its moving average, the daily bias remains bullish and aligns with the broader trend on price charts.
HyperLiquid MACD chart analysis, created Aug 27, 2025
The chart displays the Moving Average Convergence Divergence (MACD) for HYPEHUSD with standard 12, 26, and 9 settings. The MACD line (blue) prints 1.20 while the signal line (orange) stands at 0.71. The histogram currently shows green bars, reflecting positive momentum after a crossover earlier in August.
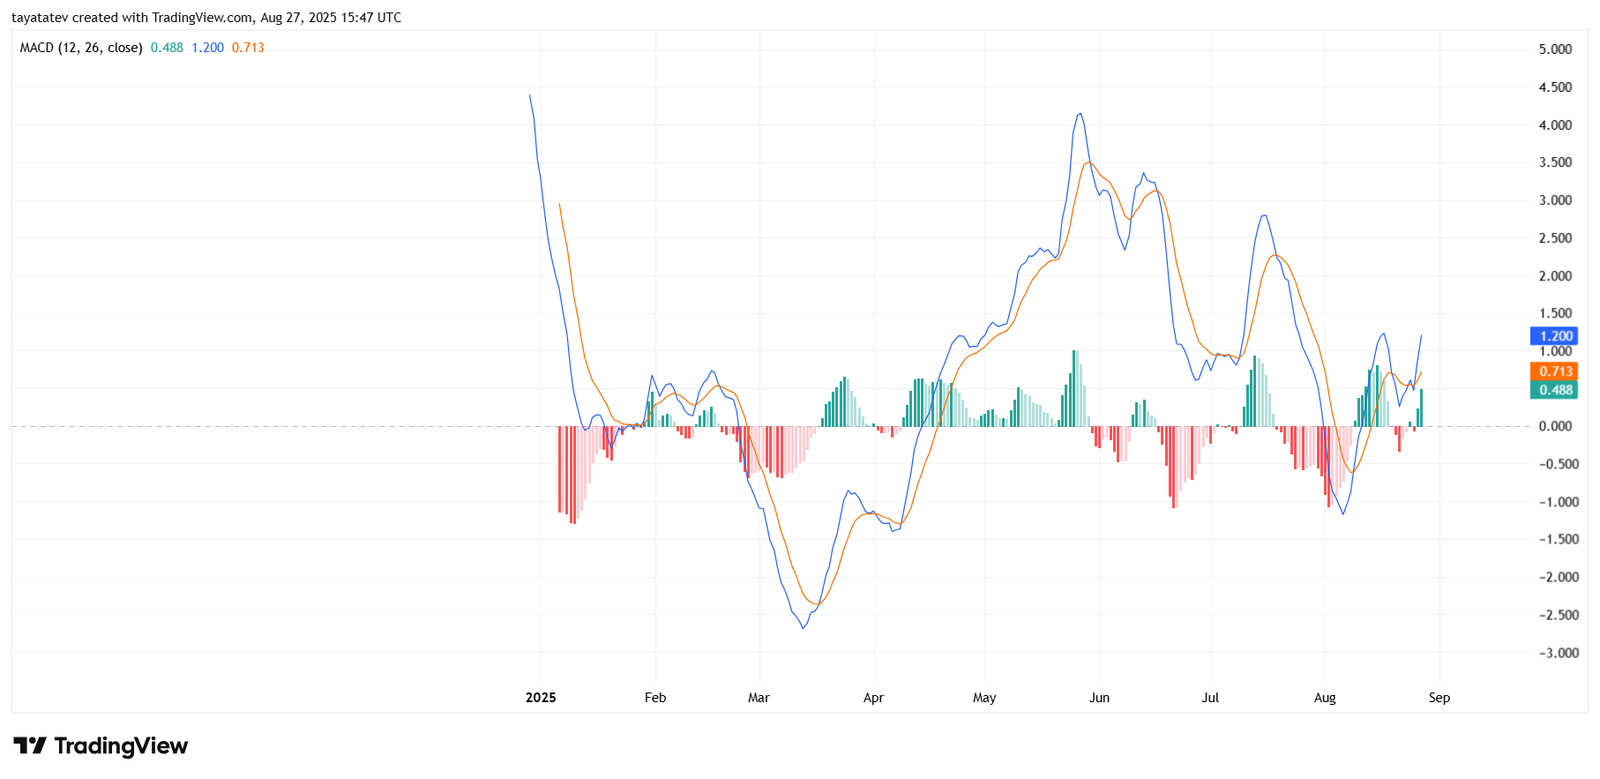
The bullish crossover occurred when the MACD line moved above the signal line while both values crossed into positive territory. This shift confirms that short-term momentum has accelerated faster than long-term momentum, which often signals the start of a broader upward phase. Previous crossovers on this chart in April and June also produced significant rallies, reinforcing the reliability of this indicator in HYPE’s trend.
Additionally, the histogram continues to expand above the zero line, suggesting momentum is strengthening rather than fading. If the MACD line sustains its trajectory above the signal line, buyers are likely to maintain control into September. However, if the histogram narrows or flips red, it would warn of weakening momentum.
The current MACD reading supports the broader bullish signals seen on the RSI and price channel charts. Together, they confirm that HyperLiquid’s near-term bias remains constructive while technical conditions align in favor of further gains.
