
Crypto commentator Noah James (@noahjames_ofc) said today that Zebec Network’s ZBCN is “reacting” as he projected, pointing to a potential inverted head-and-shoulders on the 4-hour timeframe. His update adds that the MACD looks set to cross upward, which would strengthen a bullish continuation case if the pattern confirms. He addressed the Zebec community directly, framing the setup as a momentum turn after recent drawdowns.
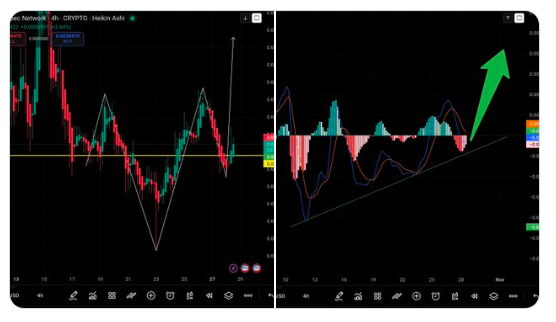
The charts you shared support that reading. The Heikin Ashi view shows a clean three-trough structure with a developing right shoulder and a horizontal neckline near the highlighted yellow band. Price action reclaimed that band intraday and printed consecutive higher lows, which often precede confirmation attempts. Moreover, candles tightened after the right-shoulder dip, suggesting sellers lost initiative as buyers stepped back in.
Momentum signals align with the pattern context. On the oscillator chart, the MACD lines compress beneath the zero line while the histogram’s red bars shorten, a sequence that commonly appears before a cross. If the lines flip positive, momentum typically tracks price through the neckline test and early follow-through. Until that happens, the move remains unconfirmed and vulnerable to stalls.
Risk markers are visible as well. The rising trendline drawn from mid-month still holds; however, a decisive close back below the right-shoulder low would invalidate the setup and shift focus to trendline defense. Conversely, a firm 4-hour close above the neckline with rising volume would complete the pattern and hand control to buyers. Therefore, today’s session revolves around confirmation: neckline reclaim, momentum cross, and sustained participation after the break.
ZBCN prints bullish pennant on the daily chart — Oct 29, 2025
The Oct 29, 2025 daily chart you shared shows Zebec Network (ZBCN/USDT) coiling inside a bullish pennant that has formed since the August impulse. A bullish pennant is a continuation pattern where price consolidates in a small, converging range after a strong advance and then often breaks higher in the trend’s direction.
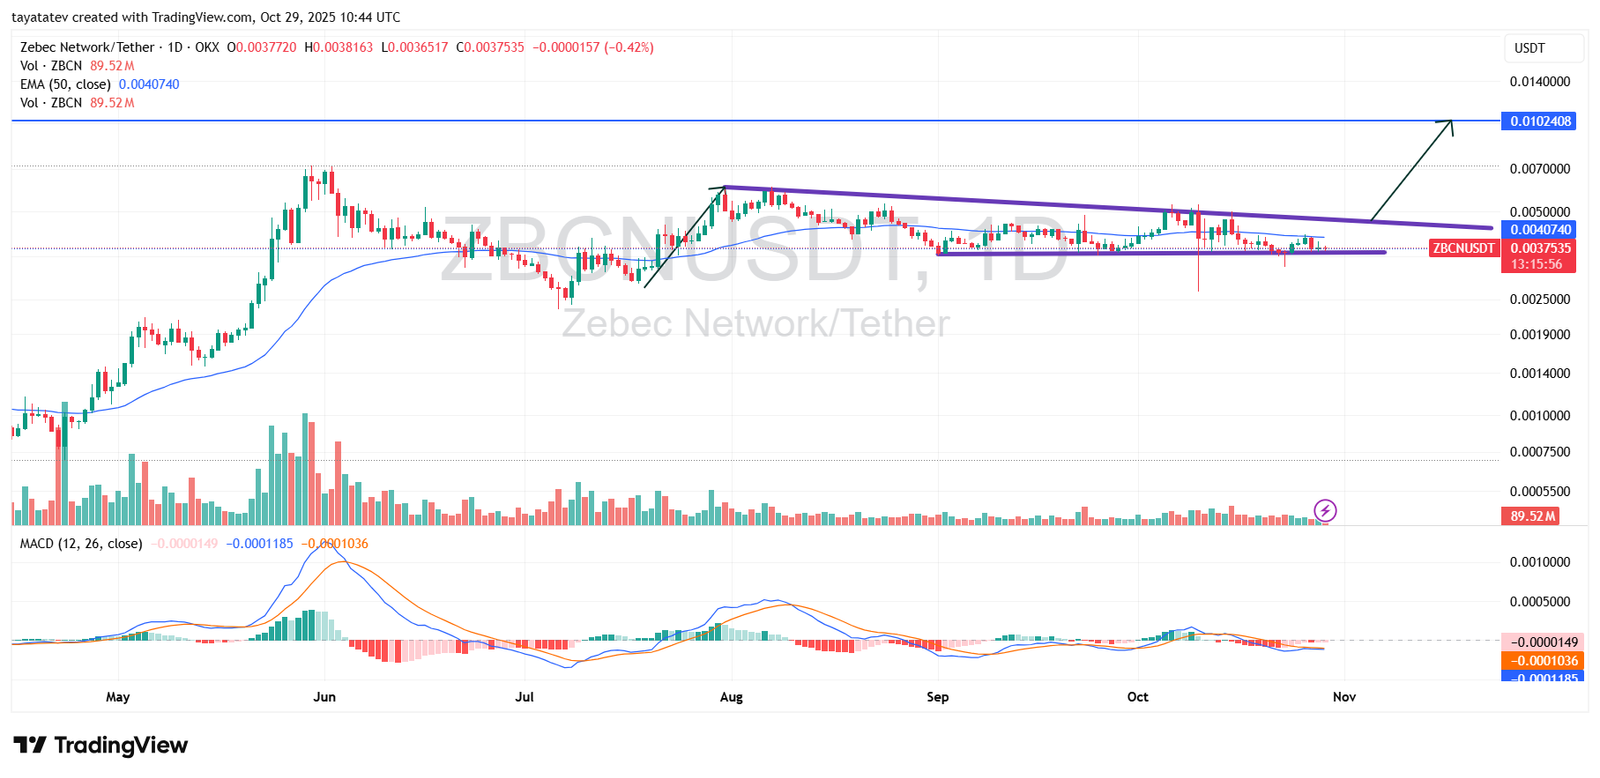
Price sits near $0.0037535. The pennant’s descending top still caps rallies. A flat base holds recent support. The 50-day EMA (~$0.004074) hovers just above. Therefore, a daily close back over the EMA matters. A close through the pennant’s top line would confirm the pattern. The MACD sits just below zero. Its lines compress. That often precedes a momentum flip if buyers push.
Upon confirmation, the prior pole sets the target. The projection implies ~+171% from here. That points toward ~$0.0102 (the chart marks ~$0.01024). Until then, the setup stays unconfirmed. A firm daily close below the lower rail would weaken it. Then focus shifts back to the late-September base.
