XDC Network’s (XDC) derivatives market recorded a sharp increase in trading activity over the past 24 hours. Coinglass data reports XDC futures volume rose by 208.88% to about $2.23 million, while Open Interest increased 7.53% to about $5.73 million. This is one of the highest Open Interest levels for XDC in the past month. The Open Interest increase means more leveraged positions are now open.
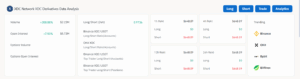
Derivatives Surge While Spot Inflows Stay Low
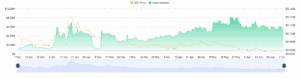
By comparison, spot market inflows remain limited. Bybit leads spot volume at about $429,000, while Bitstamp has the highest net inflow near $12,650. Overall net inflow remains slightly positive but small. Derivatives now account for over 80% of total XDC trading activity, while spot flows stay low. Heavy reliance on leverage can increase price swings but leaves the trend exposed if spot demand does not grow.
Coinglass data records about $648 worth of XDC short positions closed in the past day. This equals about 0.01% of total Open Interest. The Open Interest Weighted Funding Rate turned slightly positive, which means long positions now pay fees to keep contracts open.
Spot inflow remains low compared to leverage, so higher spot buying has not appeared yet. Small liquidation value means most short sellers still hold positions, which can add downside pressure if support breaks.
XDC Price Holds Key Support as Breakdown Risk Builds
Currently, 1 XDC to USD is near $0.0599, close to a marked support zone on the following XDC price chart. The Relative Strength Index (RSI) is around 48, which places the market near a neutral condition. If this support holds, price could test $0.0620–$0.0635, with the next resistance level near $0.065. If XDC clears $0.065, the price may approach the May swing high near $0.070. This support level acts as the immediate test for buyers to prove they can defend recent gains.
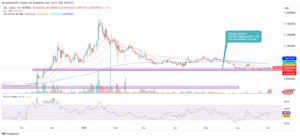
If the support fails, the price could drop toward $0.0560–$0.0570, matching the last swing low. A deeper move may extend to about $0.0540, which marks the next technical level on the chart.
XDC’s market cap remains near $971 million. Daily volume crossed $30 million, with most activity in futures. This difference between stable market cap and rising leveraged volume means recent trading is mainly in derivatives. If leveraged long positions close and spot inflow stays low, the price could move lower. A stable market cap with rising leverage often means price moves can reverse quickly if traders close positions.
From a technical perspective, XDC remains range-bound. Price holds support while leverage stays active. RSI remains near neutral. If spot inflow rises and funding stays positive, the price could test $0.0635–$0.070. If support breaks, the price may move toward $0.056
