
The XDC Network has committed $1 million to Kasu, a commercial lending protocol focused on real-world assets (RWAs). The investment strengthens XDC’s position in the growing RWA lending sector, which has seen rising adoption from institutional and retail players. Kasu’s lending model allows businesses to access blockchain-based credit solutions while using tangible assets as collateral.
By supporting Kasu, XDC signals its intention to diversify network activity beyond cross-border payments and enterprise blockchain services. The funding is aimed at scaling Kasu’s infrastructure, onboarding more borrowers, and attracting institutional lenders. As competition among blockchain platforms intensifies, RWA lending has emerged as a priority for networks seeking to connect digital finance with traditional capital markets.
Stablecoin Expansion With Native USDC and CCTP v2
Alongside the investment, XDC confirmed that it will soon integrate native USDC stablecoin support and launch the Cross-Chain Transfer Protocol (CCTP) Version 2. This upgrade will allow users to move USDC across different blockchains seamlessly, positioning XDC as a stronger player in multi-chain finance.
The addition of native USDC reflects a broader shift across blockchain ecosystems toward stablecoin adoption. Stablecoins have become critical for settlements, on-chain liquidity, and global remittance solutions. By aligning with Circle’s infrastructure, XDC is set to improve its interoperability and attract developers building DeFi, trade finance, and tokenized asset solutions.
VERT Capital Plans $1 Billion RWA Tokenization on XDC
In a separate development, Brazilian asset manager VERT Capital announced it will tokenize $1 billion in real-world assets on the XDC Network. The initiative highlights XDC’s growing role as a blockchain platform for large-scale tokenization projects, particularly in Latin America.
VERT Capital has identified tokenization as a way to unlock liquidity in illiquid markets such as real estate, private debt, and commodities. By leveraging XDC’s hybrid blockchain infrastructure, the firm expects to offer investors fractionalized access to assets that have traditionally required high entry barriers. The $1 billion tokenization plan underlines how RWA adoption is moving from pilot projects to institutional-grade implementations.
XDC Positions for Institutional Growth
The combination of direct investments, stablecoin integration, and large-scale tokenization initiatives positions XDC as a blockchain network competing for institutional adoption. With RWA tokenization accelerating globally and stablecoins becoming core to on-chain settlement, XDC is aligning itself with sectors expected to see significant growth.
The network continues to highlight these moves through its “XDC Weekly” updates, underscoring its focus on transparency and ecosystem expansion. As tokenization gains traction among asset managers, and stablecoin use cases broaden, XDC’s latest initiatives show a strategy aimed at long-term relevance in global finance.
XDCUSD Chart Forms Falling Wedge; Breakout Would Project ~75% Higher
As of Sep 8, 2025, 07:19 UTC (TradingView, 4-hour, Bitfinex), the XDCUSD chart shows a clear falling wedge bounded by two downward-sloping, converging trendlines. Price now presses against the wedge’s upper boundary near $0.080, with the 50-EMA hovering close at ~$0.07934. This setup is typically bullish when confirmed by a decisive candle close above the upper trendline and follow-through. If that confirmation arrives, a 75% advance from the current ~$0.07969 would imply a measured objective near $0.13946, broadly consistent with the $0.1389 level annotated on the chart.
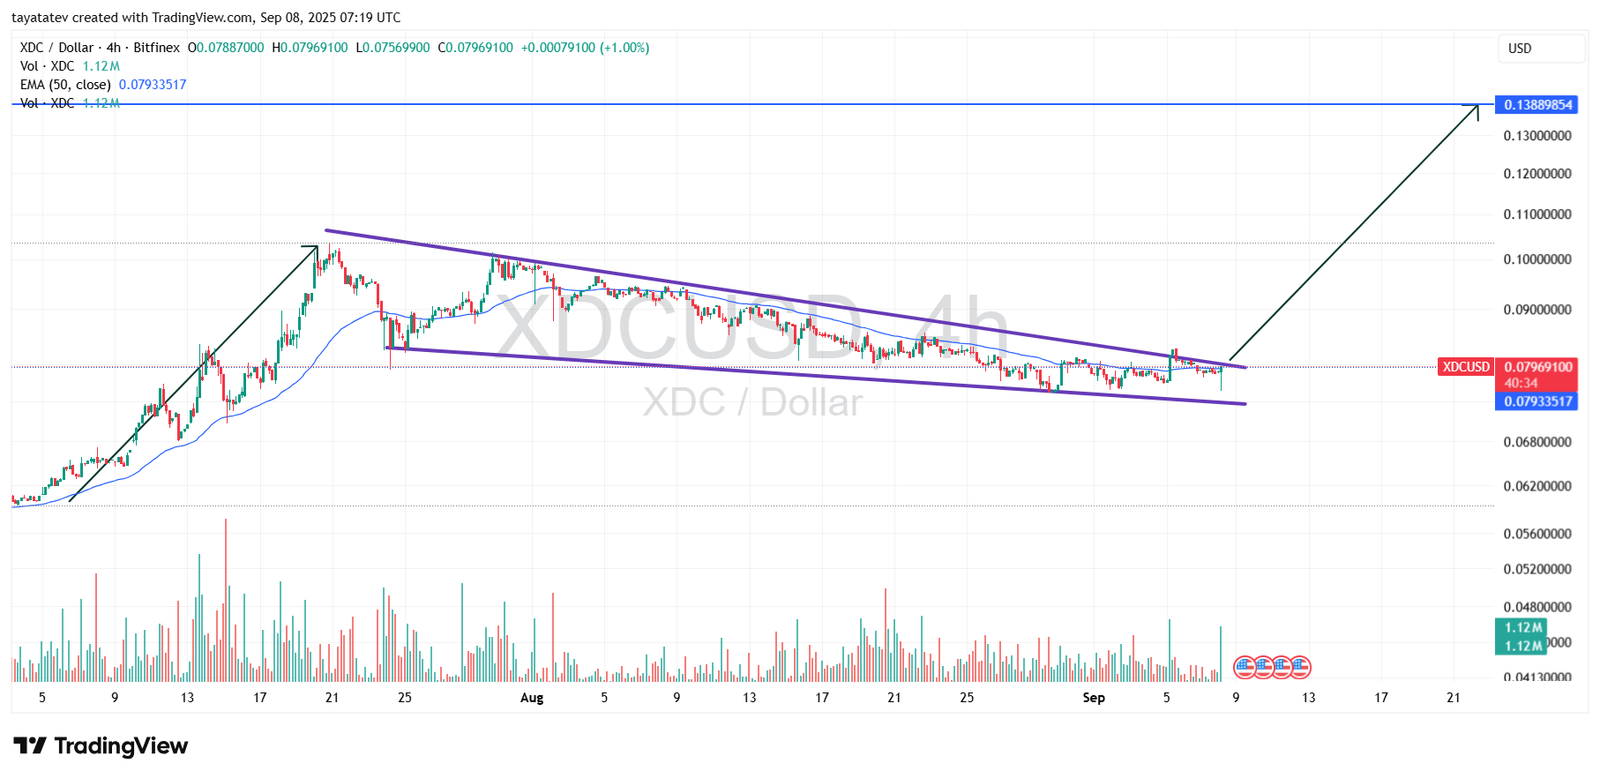
A falling wedge forms when lower highs and lower lows compress into a narrowing channel. This signals waning downside momentum. Momentum often flips once buyers break the upper boundary. Volume usually expands on the breakout as demand returns.
In this case, price action grinds along the wedge ceiling while holding the 50-EMA. That level often acts as a pivot during late-stage compressions. However, the image shows no emphatic volume or multiple closes above resistance. The breakout is not fully confirmed at the chart’s timestamp.
If bulls close above the upper trendline and hold trade outside the wedge, continuation becomes likely. The 75% arithmetic target near $0.13946 stands as a waypoint. A rejection and sustained drop back to the wedge’s lower rail would delay the move. The chart now sits at a decision point. Confirmation requires strength above resistance. Once confirmed, the upside path toward the $0.14 area opens.
XDCUSD RSI Signals Neutral Momentum With Early Bullish Bias
As of September 8, 2025, (TradingView, 4-hour), the Relative Strength Index (RSI) for XDCUSD prints at 52.70, with its moving average signal line at 50.46. The indicator has recovered from late-August lows near the oversold boundary of 30 and now fluctuates slightly above the midpoint, suggesting a shift away from bearish pressure.
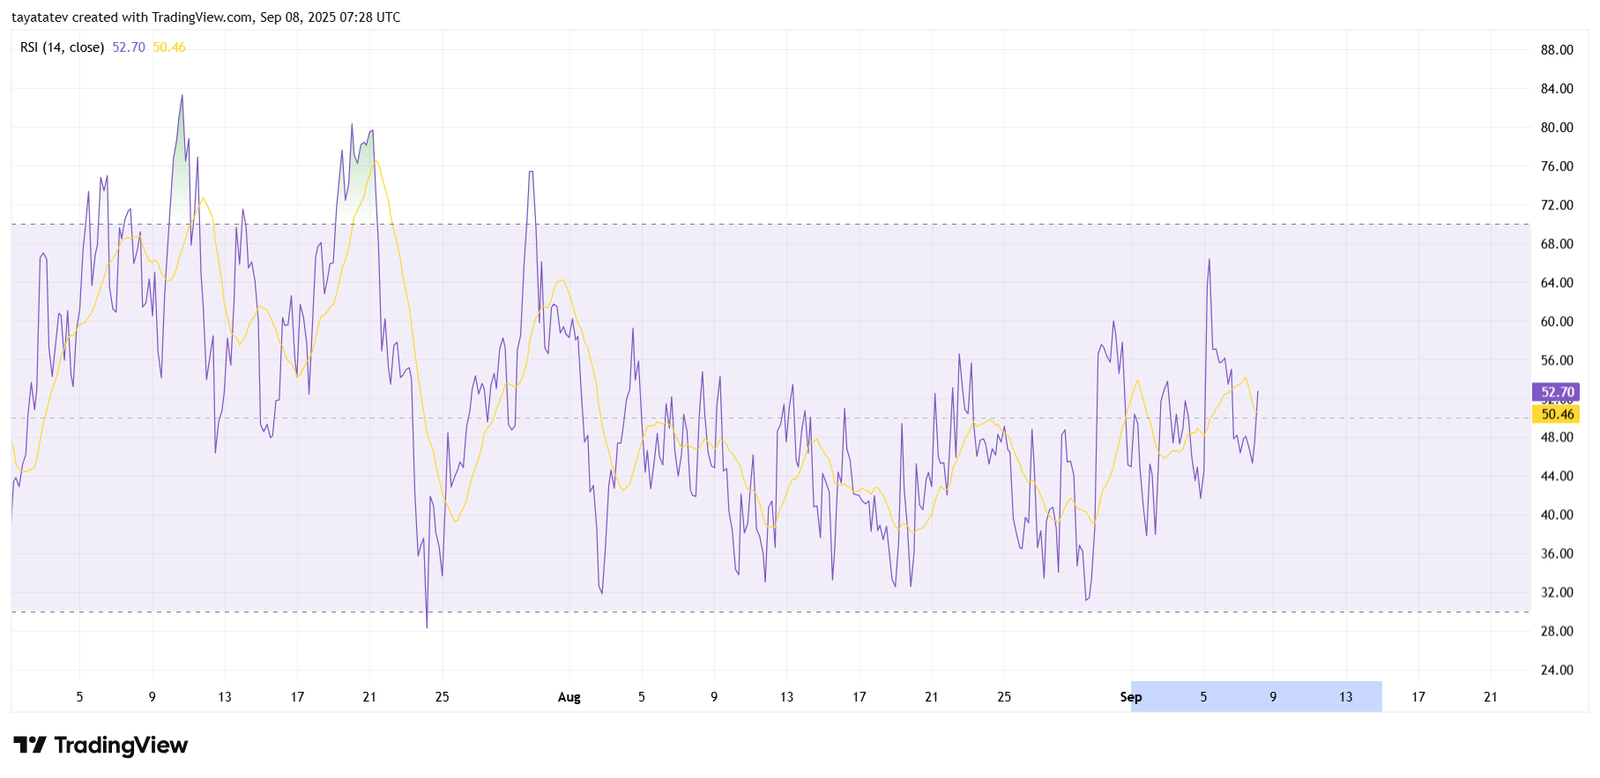
The RSI sits just above 50, a level that often signals equilibrium. At this stage, neither buyers nor sellers dominate. However, the upward slope points toward the neutral-bullish zone. This suggests early accumulation and renewed momentum.
Over the past two months, each rebound from sub-40 levels led to recoveries in XDCUSD. Therefore, the current positioning may mark the start of a stronger cycle, provided volume supports the move. In addition, the absence of overbought readings above 70 shows that upside pressure still has room to expand.
When combined with the falling wedge pattern on the price chart, the RSI reinforces a potential breakout scenario. If the index pushes above 60, it would confirm stronger bullish sentiment. Conversely, if it slips below 45, the case weakens and extended consolidation becomes likely.
At present, conditions remain balanced but tilt toward the bullish side. Momentum aligns with the developing wedge breakout setup, rather than opposing it.
