
XRP futures traders are positioning for a potential price decline, as shown by key on-chain metrics from CryptoQuant.
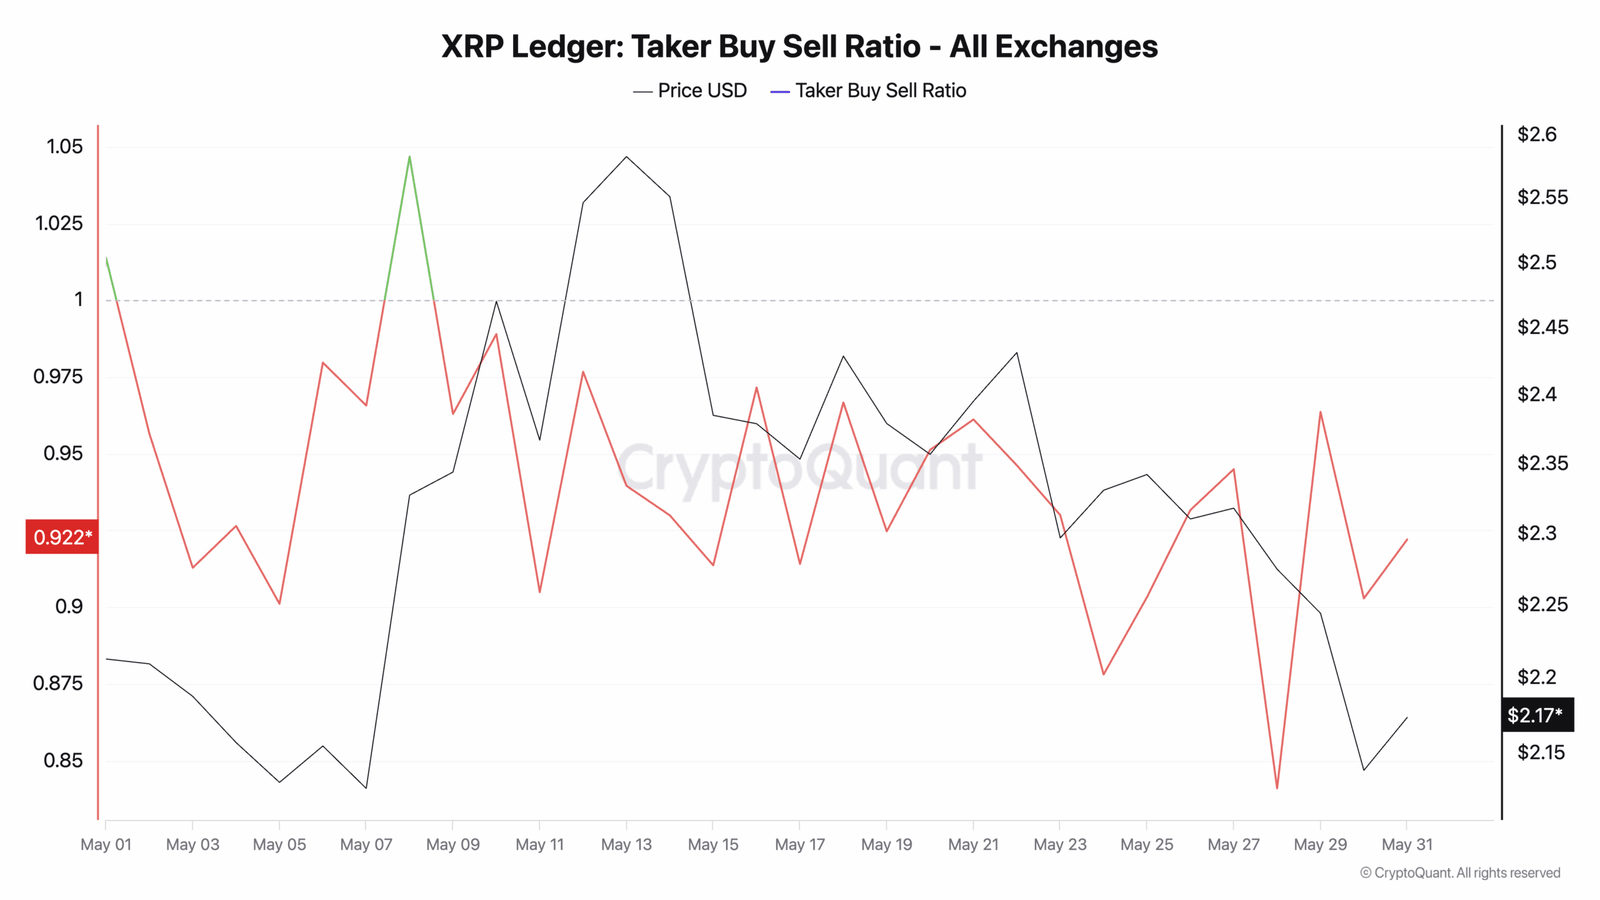
For the past two weeks, XRP’s taker buy/sell ratio has remained below 1. As of June 1, 2025, it stands at 0.92, meaning sell orders continue to outweigh buy orders in the token’s futures market.
A taker buy/sell ratio below 1 suggests increased sell-side pressure. This metric compares the volume of aggressive buy orders (taker buys) against aggressive sell orders (taker sells). When the ratio stays under 1 for an extended period, it often signals that traders are closing long positions or entering shorts.
Another bearish indicator is XRP’s long/short ratio, currently at 0.94. This shows that more traders are holding short positions, expecting the price to fall.
The data points to consistent sell pressure from derivatives traders, aligning with recent negative momentum across the XRP market.
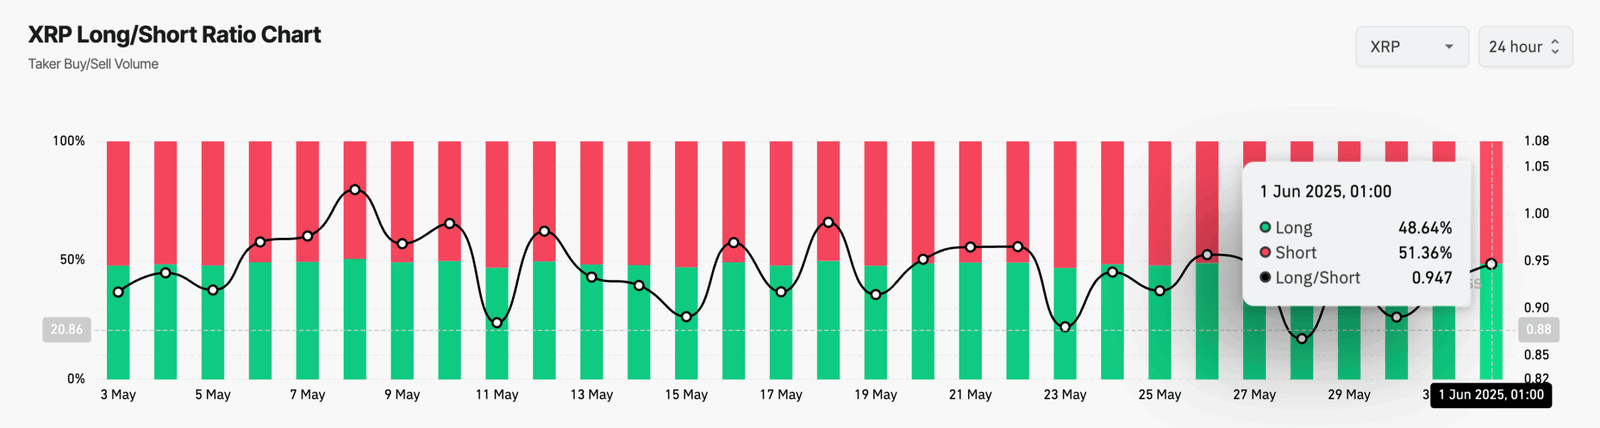
Since May 8, 2025, XRP’s long/short ratio has consistently remained below 1, according to Coinglass. The latest reading on June 1 shows a ratio of 0.947, with 51.36% of positions short and only 48.64% long. This means more futures traders are betting on a decline than a rise.
The sustained imbalance signals that bearish sentiment is not limited to brief volatility spikes. Instead, it reflects a broader market outlook where traders expect XRP to fall further. The trend has persisted for nearly a month, showing that short positions continue to dominate futures activity.
This prolonged pressure aligns with the weakening price chart and confirms that traders have not shifted toward a bullish stance.
XRP Creates Descending Channel Pattern, Eyes 33% Upside if Breakout Confirms
On June 1, 2025, the 4-hour chart for XRP to U.S. Dollar (XRP/USD) on Bitstamp formed a descending channel pattern.
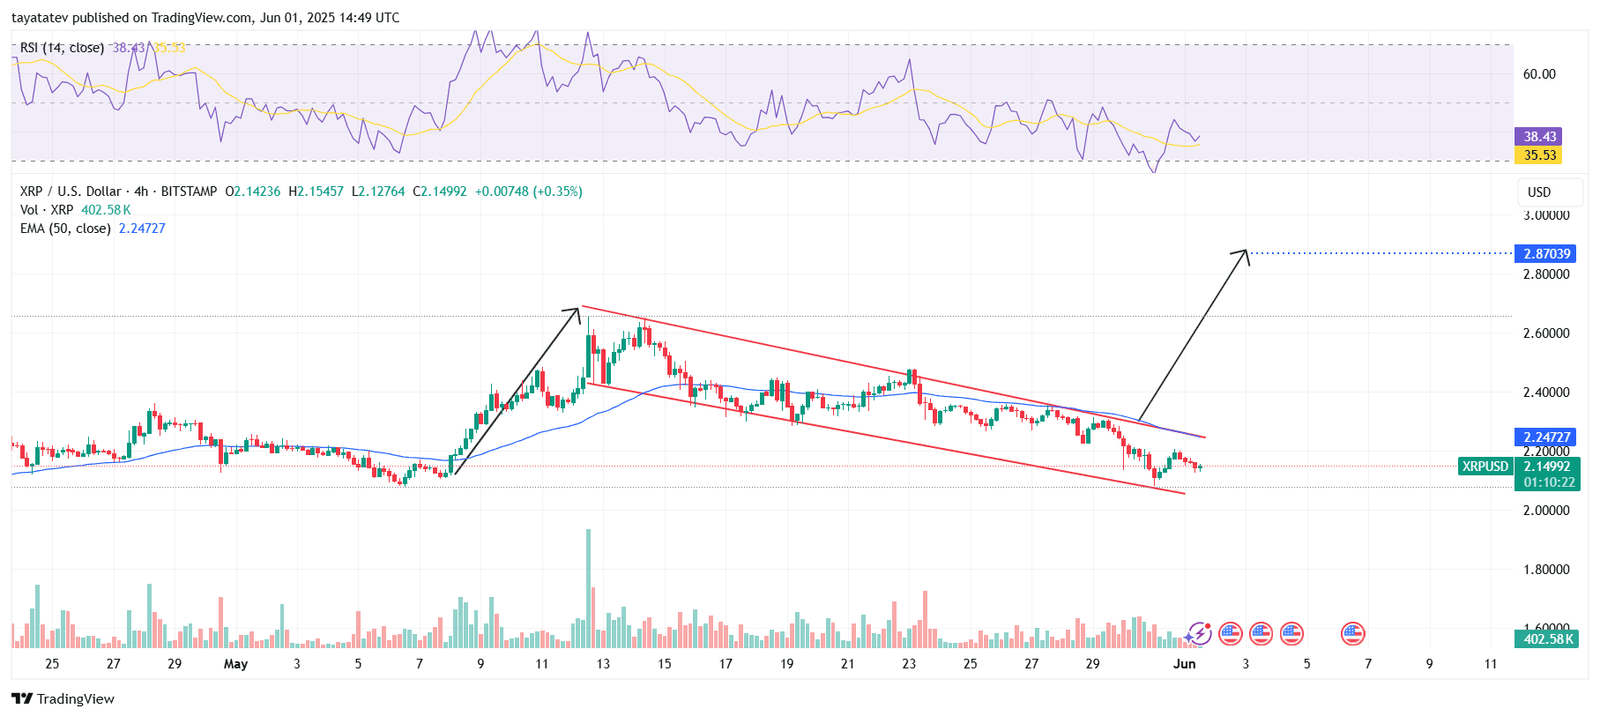
A descending channel occurs when the price moves between two downward-sloping parallel trendlines, often signaling controlled selling pressure with the potential for a bullish breakout.
XRP currently trades at $2.14992 and sits near the lower boundary of the channel. If buyers push the price above the upper red trendline, this pattern would confirm. Based on the height of the previous upward move, XRP could rally by 33% from its current level to reach the projected target of $2.87039.
Right now, XRP remains below the 50-period Exponential Moving Average (EMA), which stands at $2.24727. This suggests short-term bearish momentum. However, price action near the lower trendline and a rising Relative Strength Index (RSI) from oversold territory indicate a possible reversal.
The RSI value is 38.43, climbing above its signal line at 35.53. This crossover often hints at growing bullish momentum. Volume also shows brief surges, suggesting buyers may be entering at lower levels.
If the breakout confirms and XRP reclaims the EMA, the momentum could flip, with the $2.87039 level acting as the next key target.
XRP MACD Flashes Early Bullish Signal After Extended Downtrend
On June 1, 2025, the Moving Average Convergence Divergence (MACD) indicator for XRP/USDT showed the first bullish sign in days. The MACD line (blue) now trends upward toward the signal line (orange), with a histogram reading of +0.0020—marking a return to positive territory after an extended red phase.
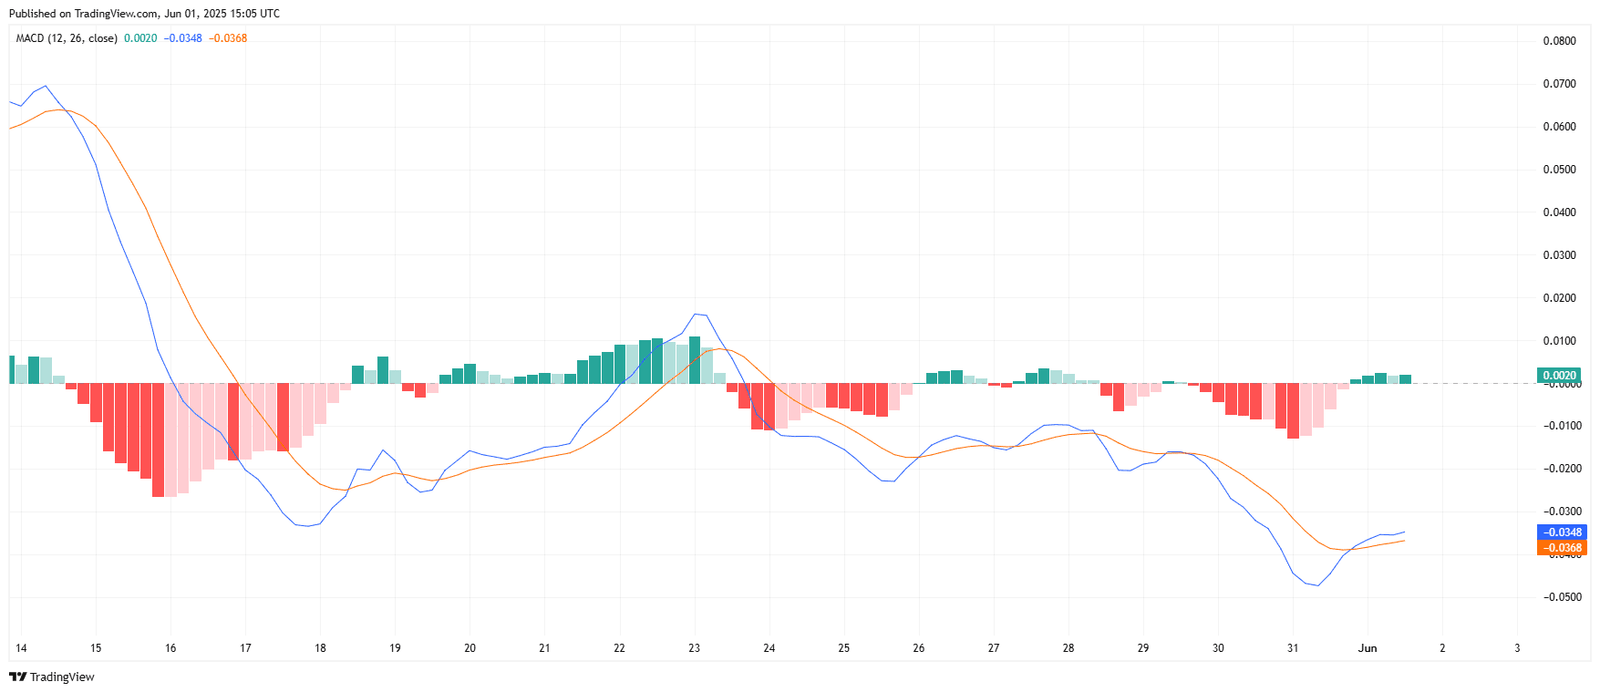
The MACD line stands at –0.0348, while the signal line is at –0.0368. Although both remain in negative territory, the narrowing gap shows that selling momentum is fading. The histogram also flipped green for the first time since May 24, indicating that bearish momentum may be weakening.
If the MACD line crosses above the signal line in the coming sessions, it would confirm a bullish crossover—typically a sign that upward momentum could follow. This shift aligns with recent chart support levels and matches the slight recovery seen in volume and Relative Strength Index (RSI) data.
In summary, the MACD shows early signs of a potential trend reversal, but confirmation will depend on the crossover and sustained histogram growth.
XRP BBTrend Indicator Stays Positive Despite Pullback
On June 1, 2025, the BBTrend (Bollinger Band Trend) indicator for XRP/USDT posted a value of 3.6462, remaining in positive territory after reaching a local peak near 14 in late May.

The BBTrend measures directional strength and momentum. Positive values, especially those above 1.0, typically confirm the presence of a bullish trend. In XRP’s case, the indicator has stayed above zero since early May, showing that bullish pressure persists despite recent price fluctuations.
While the histogram bars have shortened over the last few sessions, indicating reduced trend strength, the positive slope suggests that the uptrend is still intact. However, a continued drop in bar height may signal weakening momentum ahead.
In summary, XRP’s BBTrend holds above the baseline, supporting a bullish bias, but the current deceleration hints that traders should watch closely for either trend resumption or reversal.
XRP Drops Below Mid-Band Support on Bollinger Bands Chart
The daily XRP to Tether (XRP/USDT) chart on Binance showed the price falling below the middle Bollinger Band, which is the 20-day Simple Moving Average (SMA), currently at $2.3408.
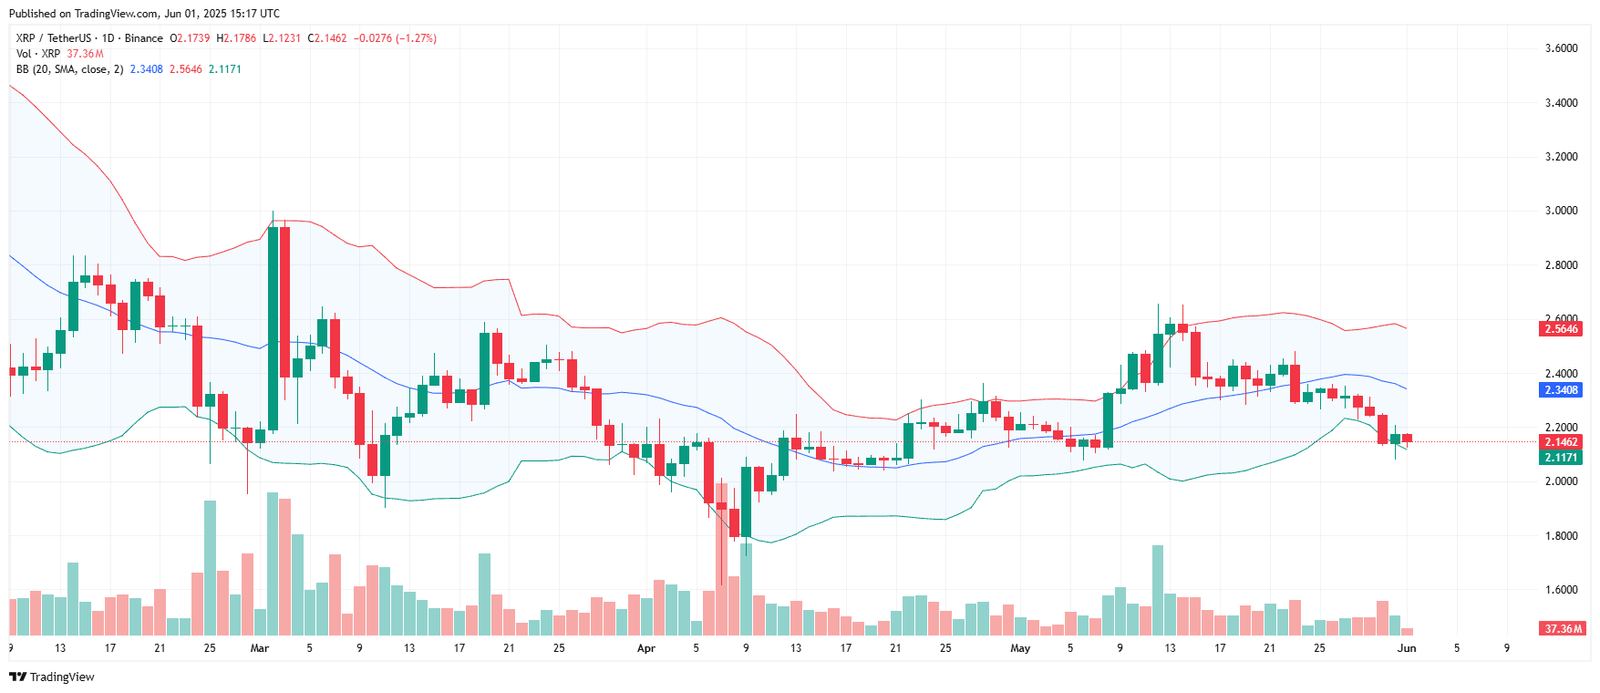
Source: TradingView
The Bollinger Bands indicator consists of a middle SMA line and two outer bands—upper and lower—set two standard deviations away. These bands help gauge price volatility and potential reversal zones.
At the time of the chart, XRP trades at $2.1462, with the lower band sitting at $2.1171 and the upper band at $2.5646. The price now rests near the lower Bollinger Band, suggesting it has entered an oversold area.
Volume stands at 37.36 million, slightly elevated during the recent decline, which signals active participation in the sell-off.
If XRP holds above the lower band and bounces, the move could act as a short-term support level. However, failure to reclaim the middle band at $2.3408 may keep bearish momentum intact.
