
Yerevan (CoinChpater.com) – XRP, the native token of Ripple Labs blockchain startup, stood at $0.85 in the European session Thursday, after testing the significant $0.82 support margin once again. However, Transparent-fx, an analyst on TradingView.com, found a bullish outlook in the cross-analysis of the daily, weekly, and monthly charts.
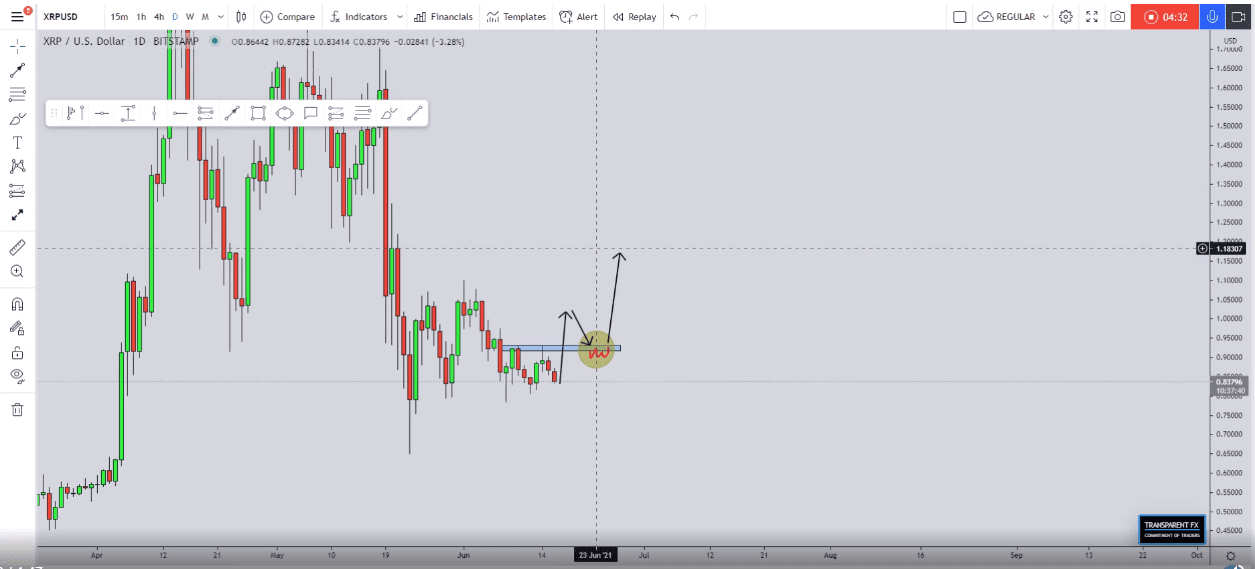
Daily Chart for XRP
On the 1D XRP/USD chart below, the analyst pointed out the uncertainty of the current market. He indicated a significant resistance level at the $0.9 price margin. According to the expert, to see a bullish progression on the daily chart, the token has to rally above the indicated margin, then correct back and test it as support. Only then an upward trend could be stable.
Also read: XRP holds above $0.8 as Ripple Labs logs another win against SEC—what’s next?
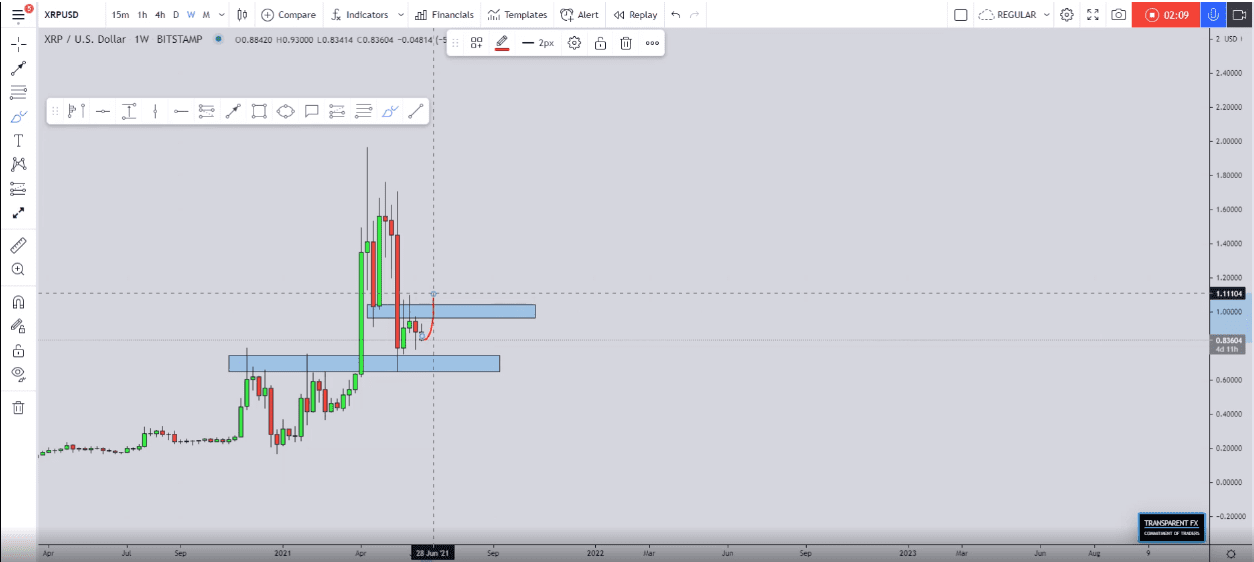
Weekly Chart
Transparent-fx also indicated two resistance/support zones on the weekly chart that proved significant in the past weeks. The bottom range (approximately $0.7-0.8) shifted its allegiance from resistance in November 2020- March 2021 to support in May 2021. The upper range ($1.0-1.3), however, flipped from support to resistance. As a result, XRP traded bounded in between the two ranges.
The analysts asserted that as long as the consolidation on the weekly charts goes on, XRP cannot log a confident bullish continuation. To see a bullish change on the weekly charts, the money transfer token would have to break up above the upper resistance range.
Monthly Outlook
Despite things hardly looking optimistic on the daily and the weekly charts, the monthly chart seems promising to the analyst. He pinpointed a previous resistance range at $0.65-0.77, which now turned to support. Moreover, the analyst drew the Fib retracement pattern from the lowest point of the latest bullish rally. The low margin of the support range stood in perfect alignment with the 0.78 Fib level. It shows a confluence of support for a bullish break.

Experts at FXStreet agree with the bullish outlook. They see the recent drop back to the $0.82 support line as a setback on the path to a bullish rally.
The daily chart for XRP indicated consolidation between $0.82 and 0.90 price margins. The weekly chart inspired more confidence if the token would manage to break the support-turned-resistance level at $1.0-1.3.
However, Transparent-fx pointed out that XRP would have to retest the said support to log a breakout. Despite the daily and weekly charts in consolidation, the monthly chart offers more incentive for a breakout. It shows a confluence of factors, including a crucial support level and the Fib retracement.
Also read: Ripple’s XRP off to reclaim $1 amid market-wide recovery
