
XRP Ledger activity rose sharply today as projects pushed more real world assets and stablecoin transfers onto the network.
Activity data cited in today’s reports shows XRPL handling about 80 percent more tokenized assets and stablecoin related operations compared with the previous month. The increase appeared in on chain flows, not in XRP spot trading, so the move is seen inside the ledger, not on exchanges.
At the center of today’s jump are RWA style records and payment like transfers that use XRPL’s speed and low fees. Because XRPL settles in seconds, tokenized instruments and stablecoins can move between addresses without waiting on external settlement rails. As a result, more projects routed their operations through XRP Ledger during the current reporting window.
In addition,sources again pointed to government level registry experiments, including the often cited Colombia land record case, to show that public sector entities still view XRPL as a suitable chain for state data. That example resurfaced today as context, since the day’s traffic increase came from the same broad use category: storing and moving real world information on chain.
XRP: Analyst Sees $13–$27 Breakout Path Forming
Technical analyst ChartNerd (@ChartNerdTA) shared a new Elliott Wave projection suggesting XRP could eventually reach between $13 and $27. His chart, published today on X, outlines a multi-year breakout structure that began after XRP exited a long corrective triangle in 2024.

According to his analysis, XRP completed a major ABC corrective phase stretching from the 2021 peak to early 2024. The breakout from that triangle, he argues, confirmed the start of a larger impulsive Wave (3) that could carry XRP into double-digit territory if momentum sustains.
The chart shows five-wave symmetry, with XRP now consolidating in what he labels Wave (2) inside the new upward cycle. A confirmed move above the current consolidation band would, under this count, mark the start of Wave (3)—the segment he targets for the $13–$27 zone.
ChartNerd framed this setup as “inevitable,” reflecting his view that structural cycles on the XRP chart are aligning with long-term bullish extensions. The projection uses standard Elliott Wave measurements rather than fundamental drivers or ETF speculation, making it a purely technical forecast based on chart geometry and previous market rhythm.
XRP Forms Bullish Flag on Oct 30, 2025, With 71 Percent Upside Toward 4.44
XRP’s daily chart on Oct 30, 2025 shows a bullish flag after the July surge. Price first jumped from about 2.00 to 3.56. After that move, it began to slide lower inside a downward channel drawn in purple. This channel stays inside the wider green zone on the chart.
In technical terms, a bullish flag forms when price makes a fast, vertical rally. That move is the flagpole. Then price cools in a narrow, sloping box. That box is the flag. The pattern says buyers still control the trend. Price is only resting before starting the next upward leg.
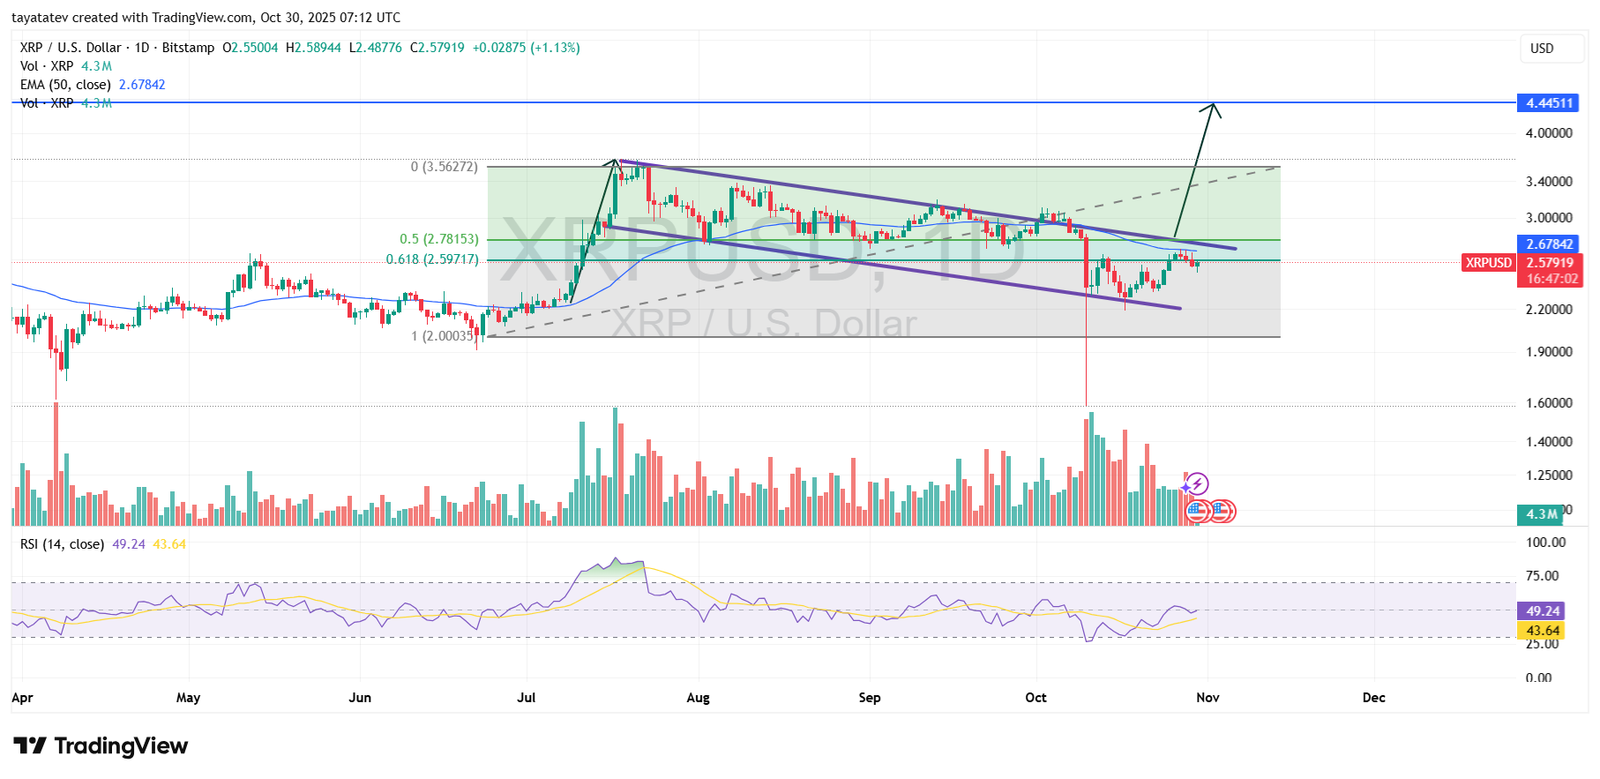
The chart now shows XRP trading near 2.57 while the 50 day EMA stands a bit higher near 2.67. Price is already pressing the upper line of the flag. If XRP closes above the flag resistance and above the 50 EMA together, that would confirm the pattern and open the breakout leg.
The chart’s target appears near 4.44511, marked by a blue line. This point stands roughly 71 percent above the current price around 2.58. The move projects almost one to one with the height of the previous impulse. In simple terms, the analyst takes the rally from 2.00 to 3.56, then applies that same distance above the breakout to find the target.
The Fibonacci retracement backs this setup. The pullback found support near the 0.618 level at 2.597 and hovered close to the 0.5 zone at 2.7815. Holding above the 0.618 level usually means a correction, not a reversal. XRP turned higher inside that retracement area, which supports a continuation view.
The RSI reads about 49, showing neutral momentum. XRP is not overbought, leaving room for buyers to push further. Volume remains around 4.3 million, still calm. That’s normal because flags often break with volume spikes only after confirmation.
If XRP closes above the flag’s upper line and regains the 50 EMA, it would confirm the breakout. The pattern then points to a rise from 2.58 to 4.44, a 71 percent gain. If resistance holds, the setup stays valid but unconfirmed.
