XRP at Critical Pivot Will It Crash to $2 or Rally 25% to $2.91
SHARE
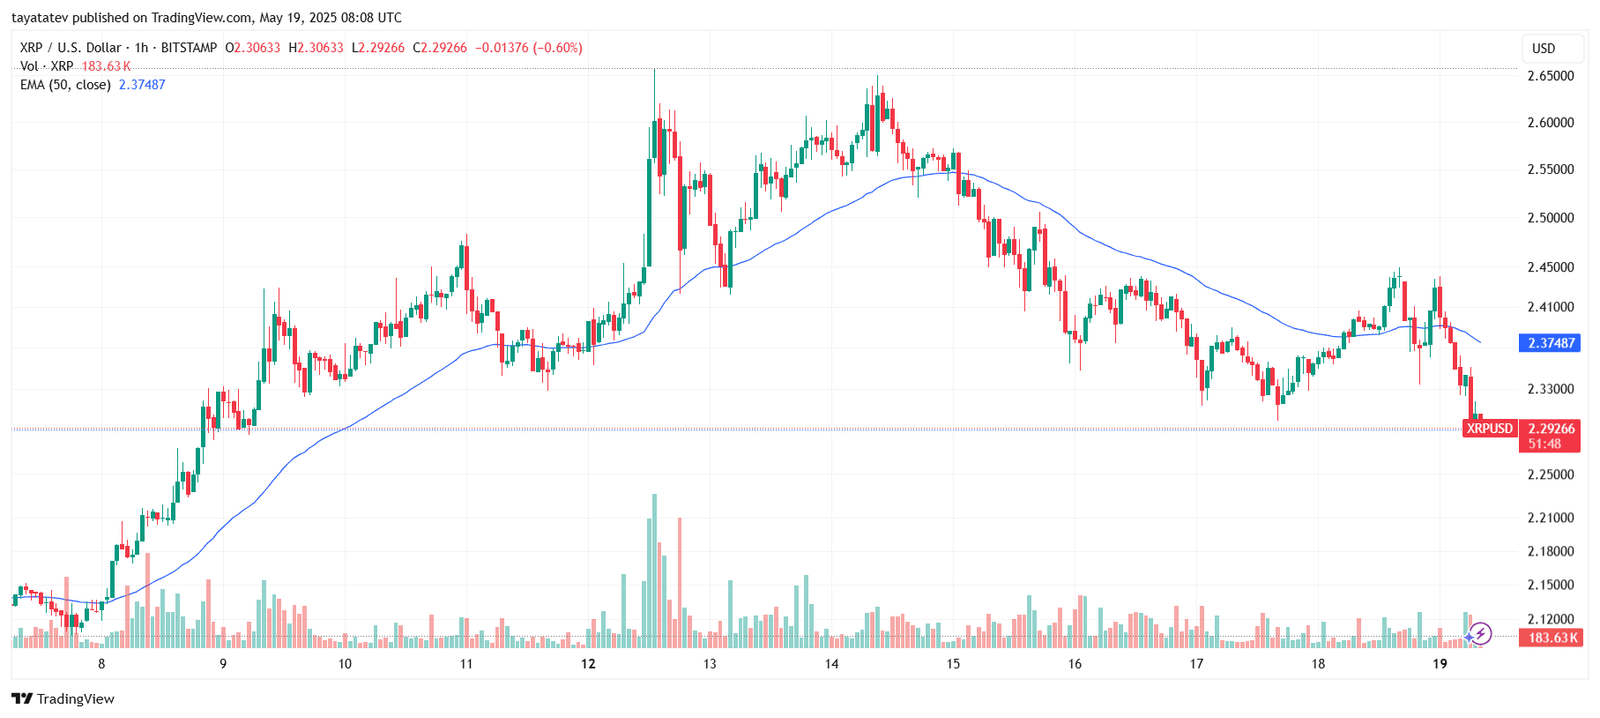
Ripple’s XRP surged to $2.45 on May 18 but faced immediate rejection. The one-hour chart from TradingView shows the price failed to sustain above the 50-period Exponential Moving Average (EMA), which now sits at $2.37487. After multiple failed attempts to reclaim this level, XRP turned sharply lower and fell back to $2.30.
XRPUSD 1H Chart. Source: TradingView.com
As of May 19, XRP trades at $2.29266, just below this support. The horizontal line at $2.30 has acted as a key level since May 17, with price bouncing from it several times. Now, the continued pressure below the EMA and the formation of consecutive red candles show that bears are in control.
If XRP breaks and closes below $2.30, the next support zone appears near $2.12. However, if sellers accelerate, the price could fall as low as $2.00—an area where the token found strong demand earlier in 2025. The trading volume remains stable, suggesting that any sharp move from here may follow a clear direction.
XRP Forms Bearish Head and Shoulders Pattern, Eyes $2.00 Breakdown
The chart shared by analyst Ali Martinez on May 18, 2025, shows a clear Head and Shoulders pattern on the XRP to United States Dollar (XRP/USD) 1-hour chart. This technical formation often signals a potential trend reversal from bullish to bearish.
XRPUSD 1H Chart. Source: Ali Martinez on TradingView.com
In the chart, XRP formed a Left Shoulder near $2.45, then surged toward $2.70 to create the Head. After that, it failed to reach the previous peak and formed the Right Shoulder just under $2.45. The neckline—marked by the shaded horizontal zone—sits around $2.30, which is the same critical support level highlighted in Martinez’s recent analysis.
At the time of the snapshot, XRP hovered around this neckline. Martinez emphasized that if this support breaks, it could trigger a sharp decline toward $2.00. This area has repeatedly acted as a strong base since the beginning of 2025, making it the next logical support target.
The symmetry of the pattern, combined with falling highs and consistent testing of the neckline, increases the chance of a bearish continuation. If XRP closes below the $2.30 zone with volume confirmation, the head and shoulders breakdown could gain momentum toward the $2.00 level.
Whale Cuts XRP Exposure as TD Sequential Flashes Rebound Signal
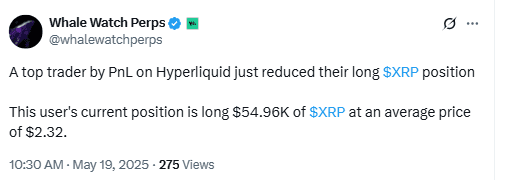
Meanwhile, Whale Watch Perps, an X account tracking major trader movements, reported that a large whale with a strong profit-and-loss record has reduced their long XRP position. This move may signal a bearish shift in sentiment among bigger players.
Whale Reduces Long XRP Position. Source: Whale Watch Perps on X
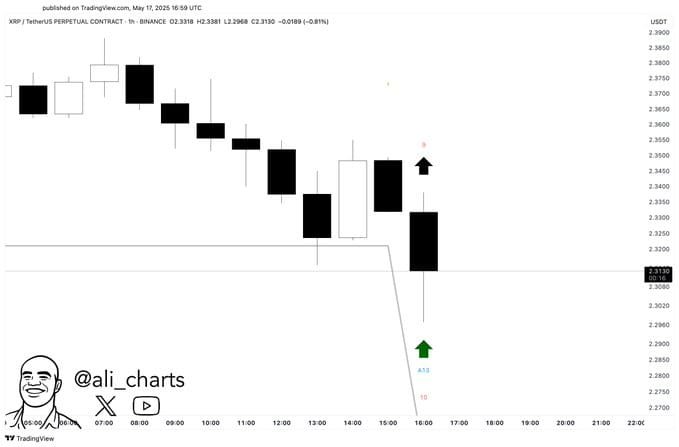
Despite the downward pressure, analyst Ali Martinez highlighted a potential reversal for XRP based on the TD Sequential indicator. The one-hour chart from May 17, 2025, shows a buy signal (9 candle) forming just after a sharp drop to $2.30 on the Binance XRP/USDT pair.
- Advertisement -
XRPUSDT 1H Chart. Source:Ali Martinez on TradingView.com
The TD Sequential, a tool used to identify trend exhaustion and possible turning points, printed a green setup count near the bottom of the current candle structure. This signal appears as the price touches the lower boundary of the recent range, suggesting a pause—or even a bounce—could follow.
While XRP dropped aggressively before this signal, the appearance of both a TD 9 and a green arrow reinforces the short-term possibility of recovery. If the indicator plays out as expected, XRP may attempt a rebound toward earlier resistance levels, possibly near $2.35.
However, confirmation would require a strong hourly close above the signal candle’s high, with support from rising volume.
- Advertisement -
XRP Search Interest Spikes Again After Months of Decline
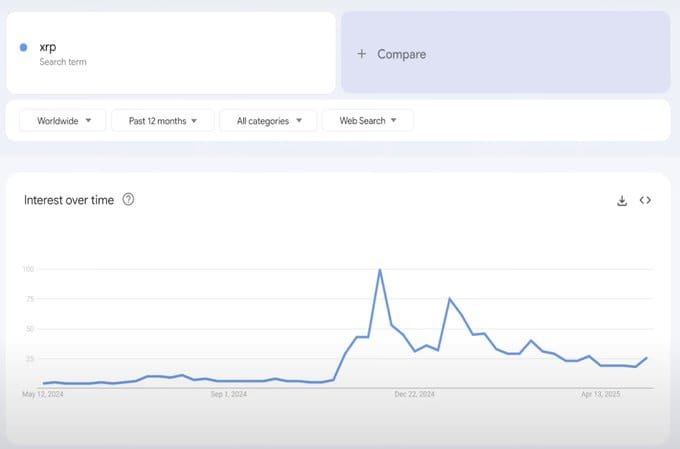
In addition, user Xoom shared GoogleTrends data revealing a noticeable uptick in global search interest for “XRP.” The chart tracks web search activity over the past 12 months and shows that after a prolonged period of flat engagement through mid-2024, interest began climbing rapidly around late November.
XRP Google Search Trend – 12-Month Data. Source: Xoom via Google Trends
The spike peaked in December 2024—likely aligning with major price action or news—and although it declined afterward, the trend remained higher than earlier levels. Most recently, the data shows another increase in April 2025, signaling renewed curiosity about XRP.
According to Xoom, such recoveries in search momentum often precede significant price moves. These spikes typically reflect growing retail attention and can act as early signals of volatility returning to the asset.
XRP Forms Falling Wedge, Eyes 25% Breakout Toward $2.91
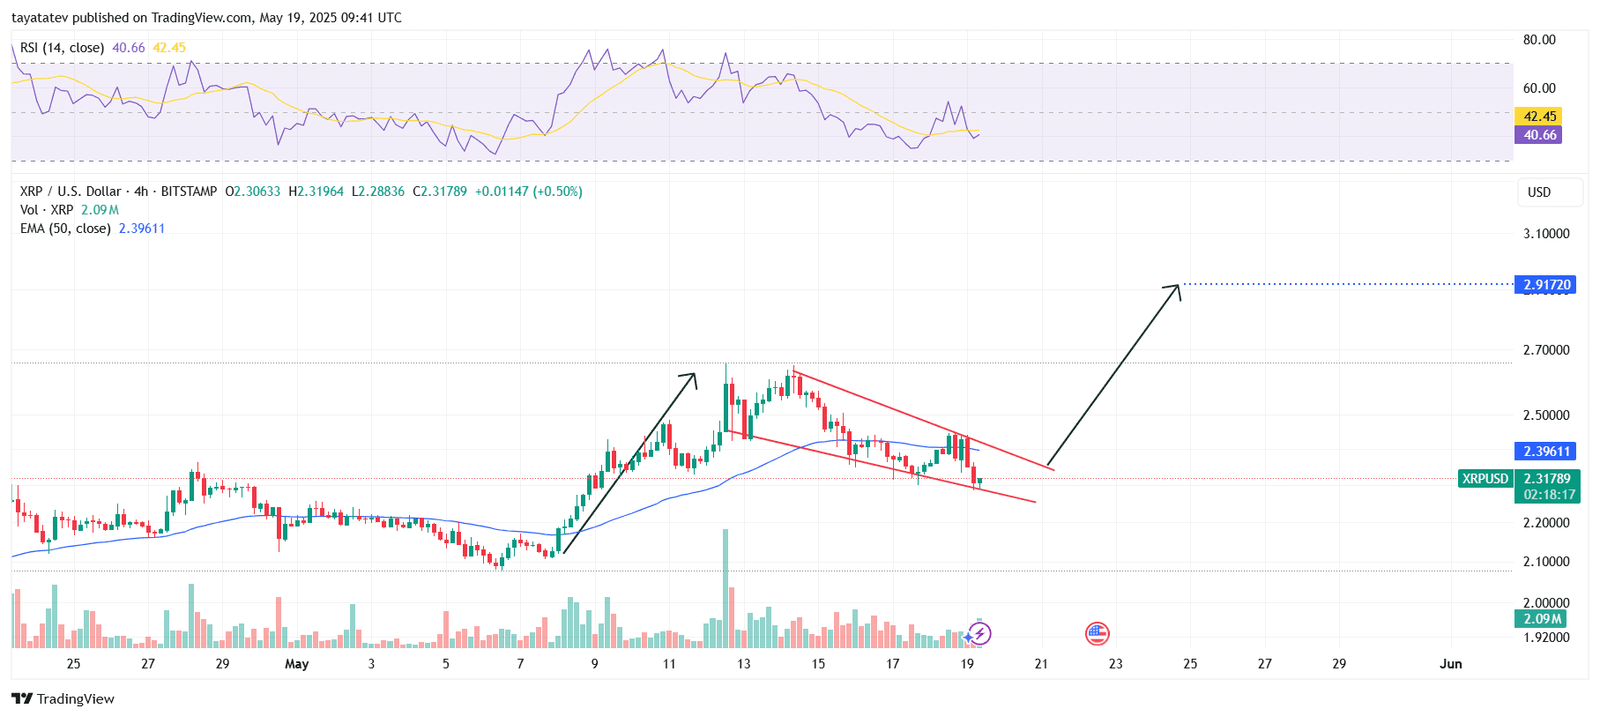
However, on May 19, 2025, Ripple’s XRP formed a falling wedge pattern on the 4-hour chart. A falling wedge is a bullish reversal formation where price moves between two downward-sloping, converging trendlines, indicating weakening selling pressure and the potential for a breakout to the upside.
If XRP confirms a breakout above the wedge’s upper trendline, the price may rally nearly 25% from the current level of $2.31 toward the projected target of $2.91.
At the same time, the Relative Strength Index (RSI), which measures market momentum, shows a reading near 40.66—a level typically associated with oversold conditions. This supports the case for a possible reversal if demand picks up. The price also hovers just below the 50-period Exponential Moving Average (EMA), currently positioned at $2.39611. Reclaiming this line would further strengthen the bullish scenario.
Meanwhile, volume has remained steady, but a spike could confirm breakout momentum. If XRP breaks above the wedge with volume support, it could trigger a strong move toward the $2.91 resistance zone.
Tatev Avetisyan is a Markets Writer and Analyst at CoinChapter, covering cryptocurrency markets, policy, and regulation. With over seven years of experience in business and marketing development, she has spent the past two years specializing in digital assets and has authored more than 2,000 articles on crypto markets and regulatory developments.She contributes as a guest writer to leading industry publications and is a prominent Web3 advocate in Armenia through Web3Armenia. Her work reflects a broader focus on artificial intelligence and Web3 technologies.
Tatev maintains a diversified crypto portfolio, with Bitcoin as her primary holding above CoinChapter’s $1,000 disclosure threshold.