XRP price climbed 14.31% over the last seven days, reaching a high of $2.65 before pulling back to $2.48 as of May 15, 2025. The chart confirms a peak on May 14, followed by two red candles indicating selling pressure.

This increase brought XRP’s market cap to approximately $154 billion, surpassing USDT and making XRP the third-largest cryptocurrency. Ethereum remains second at $307 billion, while Bitcoin leads with over $1 trillion in market value.
XRP temporarily broke through the $2.56 resistance level, hitting $2.657. However, the price did not establish $2.56 as support. If this level fails, the XRP price could retreat toward the $2.32–$2.26 support zone. A recovery above $2.65 would be required to test the next major resistance near $2.95.
XRP Breaks Out of Falling Wedge Pattern, Signals Possible 80% Rally Toward $4.41
As of May 15, 2025, the XRPUSD chart shows a clear breakout from a falling wedge pattern. A falling wedge is a bullish chart formation where the price forms lower highs and lower lows between two converging downward-sloping trendlines. It often signals a potential reversal or continuation to the upside once broken.

XRP already moved up by 8% from the breakout point. The breakout started above the upper trendline of the wedge, indicating early confirmation. If the breakout holds and buying volume increases, the projected move from this pattern could push XRP up by around 80% toward the $4.41 level.
This 80% target comes from measuring the widest part of the wedge and applying that height from the breakout level. The pattern began forming in late December 2024, with the upper and lower trendlines gradually tightening until the breakout in mid-May.
The Relative Strength Index (RSI) stands at 59.94. This reading remains below the overbought level of 70, suggesting there may still be room for further movement. The 50-day Exponential Moving Average (EMA) is currently at $2.26, which XRP has already cleared.
Volume is relatively low at 2.05 million, which means the breakout will need stronger confirmation from increasing volume to maintain momentum. Still, the technical structure supports the bullish setup, as long as XRP stays above the wedge resistance line, which now acts as support.
If XRP dips below $2.26 again and re-enters the wedge range, that would invalidate the breakout. However, if it holds this structure, the chart suggests a possible move toward $4.41 in the medium term.
XRP ADX at 21.04 Suggests Weak Trend, Momentum Still Unconfirmed
Meanwhile, the XRP ADX (Average Directional Index) is currently at 21.04, based on the chart from May 14, 2025. This value sits below the 25.00 threshold, which typically signals the beginning of a strong directional trend. With ADX below that level, XRP price momentum has not yet confirmed a reliable uptrend.
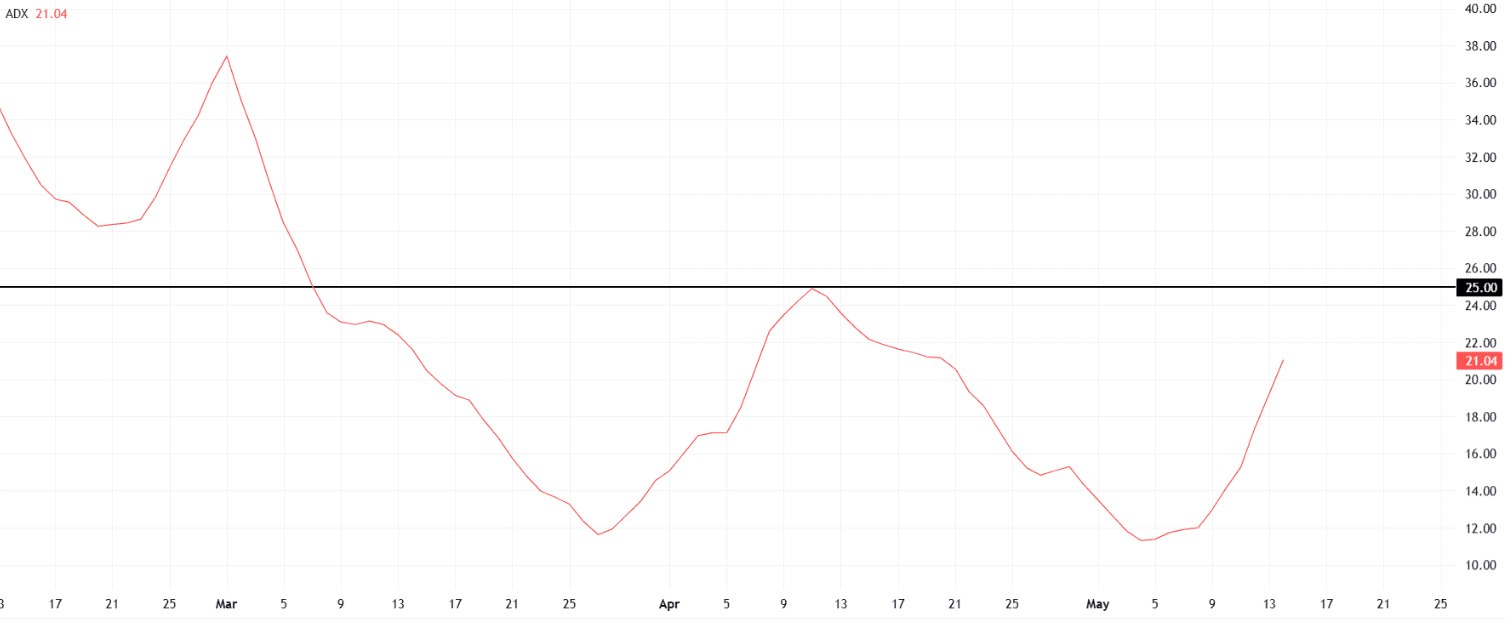
Throughout March and early April, the ADX remained in decline, falling from around 34 to near 11. This steady drop indicated a weakening trend after earlier volatility. By mid-April, the ADX began to recover slightly, reaching just under 25 before slipping again.
Between April 25 and May 5, the ADX hovered between 11 and 15, confirming a period of low trend strength. However, starting May 6, the ADX turned upward, showing a steady increase. By May 14, the ADX reached 21.04, marking its highest reading since mid-April but still short of the 25 mark needed for trend confirmation.
If the ADX continues to rise and crosses above 25, it would indicate that the XRP price is entering a stronger trend phase. In past cycles—such as in November 2024—an ADX above 25 supported a sustained rally. Until that level is breached, the current XRP price movement remains technically unconfirmed in terms of trend strength.
The next few sessions will determine whether the ADX continues its upward slope or flattens out again. Traders watching XRP will likely view a move above 25 as a sign of growing momentum behind the recent price action. For now, the ADX suggests that the trend is forming, but not yet established.
XRP Market Cap Slides to $144B After Topping $150B
XRP market cap reached a high of $150.58 billion on May 14, 2025, before slipping to $144.47 billion as of May 15. This brief peak allowed XRP to surpass Tether (USDT) and become the third-largest cryptocurrency by market capitalization.

At the same time, XRP’s 50-day Exponential Moving Average (EMA) stands at $132.44 billion. The market cap remains above this average, suggesting XRP is still in an upward structure, though the 3.26% drop highlights increased selling pressure.
Volume on the day reached 4.88 billion, indicating active trading and some short-term profit-taking. Whether XRP can stabilize above the $144 billion level will depend on upcoming trend strength.
XRP price levels at $2.56 and $2.95 remain key indicators for support and resistance. With the Relative Strength Index (RSI) near 70 and the Average Directional Index (ADX) at 21.04, the market has not yet confirmed a strong uptrend.
