On June 3, 2025, the 4-hour chart for XRP to U.S. Dollar (XRP/USD) on Bitstamp revealed a descending channel pattern. A descending channel forms when the price moves between two downward-sloping parallel trendlines, typically signaling controlled selling pressure. When price breaks above the upper trendline, it often indicates a potential bullish reversal.

In this case, XRP/USD has just touched the upper boundary of the descending channel, trading at $2.20562. The 50-period Exponential Moving Average (EMA), currently at $2.22378, also acts as a resistance zone.
If the breakout confirms, the projected target lies near $2.81432. This marks a 28% potential increase from the current price. The projection mirrors the height of the previous upward move before the channel began, extending it from the breakout point.
Trading volume is showing slight accumulation, while the price starts moving above recent lower highs. If momentum continues and XRP closes multiple candles above the upper channel and EMA, it would support the bullish breakout scenario.
Further confirmation would come from increasing volume and a sustained move above the $2.30 resistance range.
XRP Relative Strength Index Signals Growing Bullish Momentum
On June 3, 2025, the 4-hour Relative Strength Index (RSI) chart for XRP to U.S. Dollar (XRP/USD) showed the RSI rising to 53.36. The RSI is a momentum oscillator that measures the speed and change of price movements over a 14-period range. It helps identify overbought and oversold conditions on a scale from 0 to 100.

An RSI above 50 suggests growing bullish momentum, while a reading below 50 reflects bearish pressure. Currently, XRP’s RSI has crossed above its signal line (the yellow moving average), which sits at 43.82. This crossover indicates a shift toward bullish sentiment.
The RSI remains within the neutral range, well below the overbought threshold of 70. This implies that XRP still has room to move higher before reaching overheated conditions. Additionally, the recent bounce from below 30 confirms that buyers are re-entering the market after a period of strong selling.
If the RSI continues upward and breaks above 60, it could further support the breakout from the descending channel pattern seen in the price chart.
XRP Directional Movement Index Confirms Weak Trend, Signals Potential Turnaround
On June 3, 2025, the Directional Movement Index (DMI) for XRP to U.S. Dollar (XRP/USDT) showed mixed signals. The DMI consists of three key components:
+DI (Positive Directional Indicator) in blue: 13.97
−DI (Negative Directional Indicator) in red: 18.29
ADX (Average Directional Index) in orange: 23.47
The negative directional indicator remains slightly higher than the positive one, which suggests bearish pressure is still present. However, the gap between them is narrowing, showing that selling strength is weakening while buying pressure is gradually building.
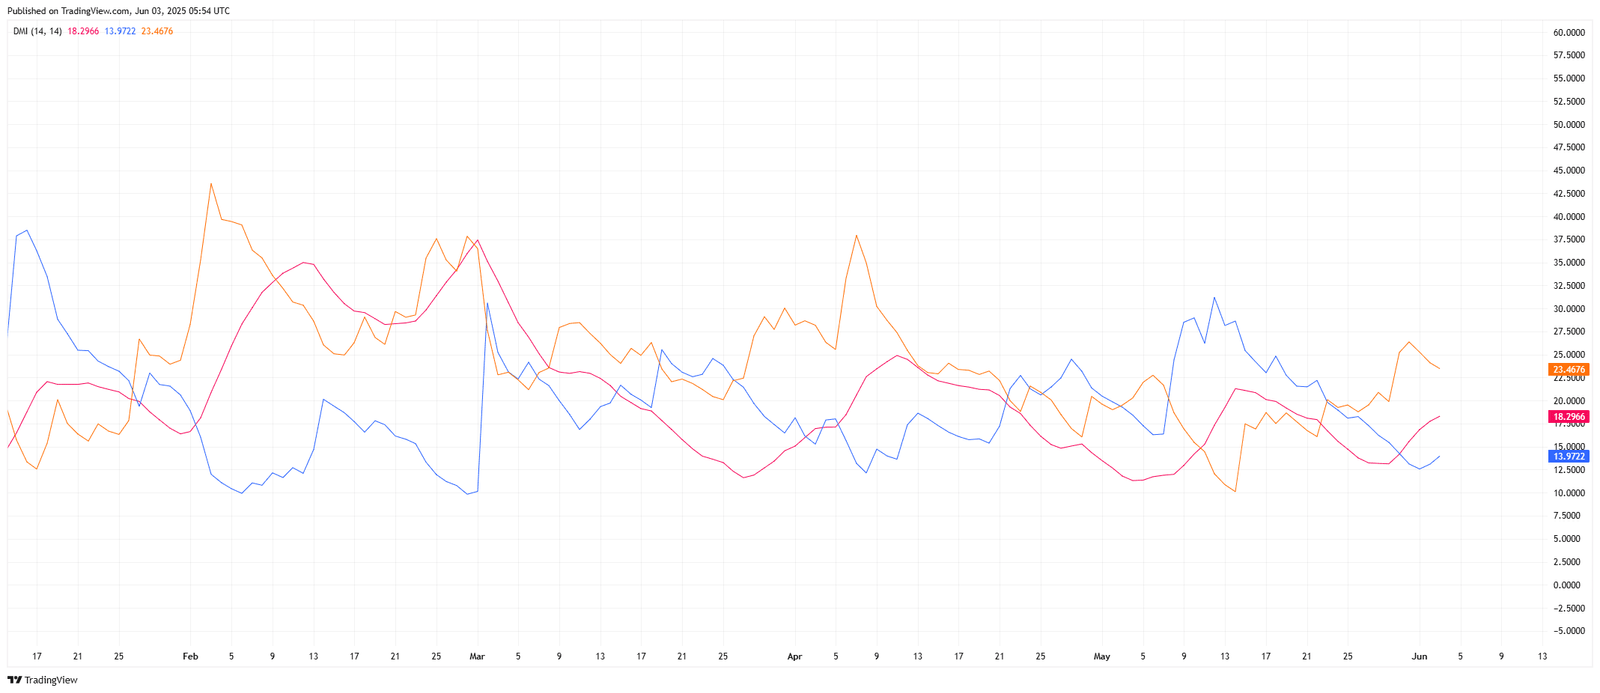
The Average Directional Index sits just above 23, which indicates a weak but possibly strengthening trend. ADX values above 25 typically confirm strong directional movement, while values below that suggest consolidation or trend indecision.
If the +DI continues rising and crosses above −DI, paired with a rising ADX, that would confirm a bullish reversal. For now, XRP shows early signs of trend change, but confirmation depends on whether bulls can push above current resistance levels.
XRP MACD Signals Fading Bearish Momentum Ahead of Possible Reversal
The Moving Average Convergence Divergence chart for XRP to U.S. Dollar showed that bearish momentum is weakening. The MACD line trades below the signal line, which still confirms a bearish trend. However, the histogram bars have become shorter, indicating reduced selling strength.
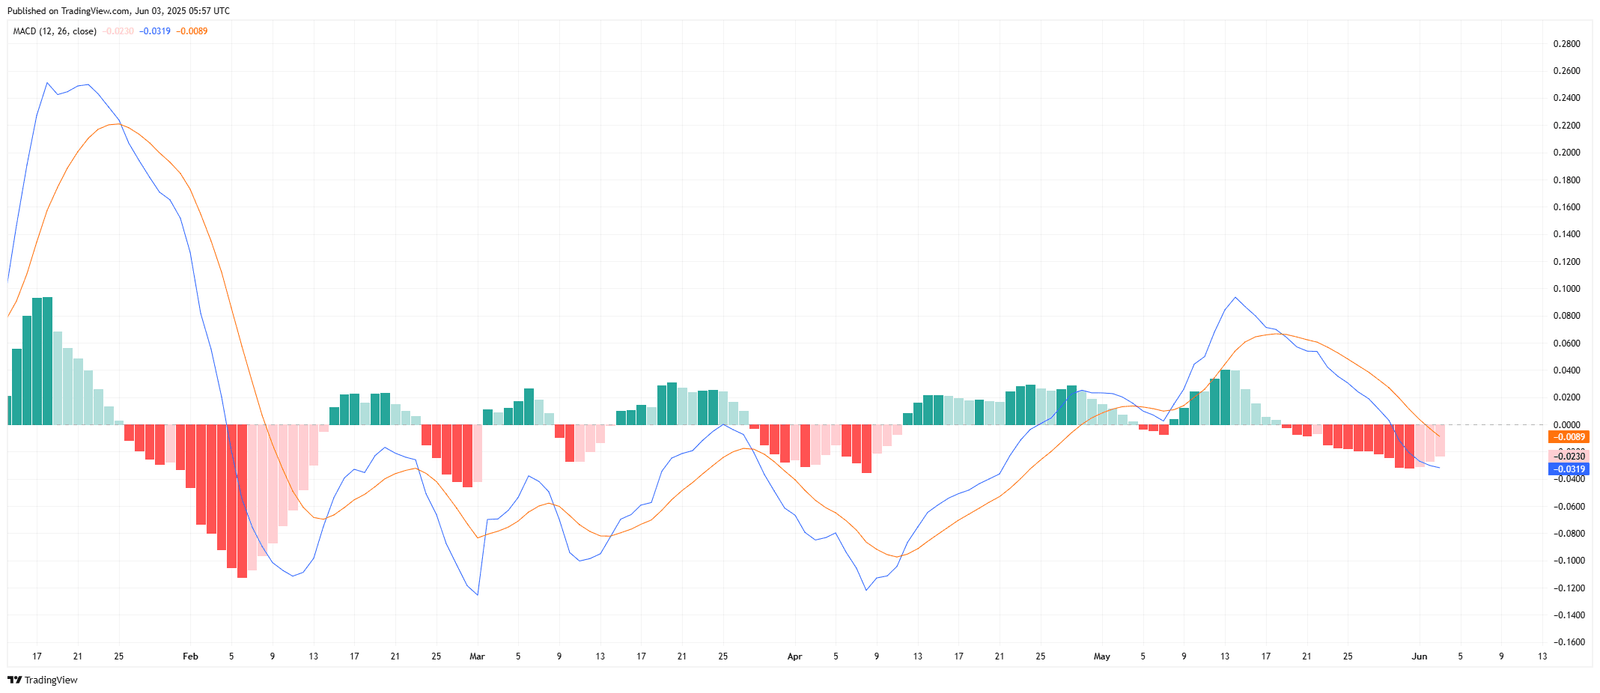
The MACD and signal lines are now close to each other, showing that the downtrend may be losing force. If the MACD line crosses above the signal line, it would signal a bullish reversal. The histogram, which reflects the distance between these two lines, is approaching the zero level. This means momentum is almost flat and could soon shift in favor of buyers.
XRP needs a crossover to confirm a breakout from the descending channel pattern on the price chart. For now, momentum appears to be shifting from bearish to neutral.
XRP Gets $100M Demand Boost as Bitgo, ViviPower Announce Strategic Partnership
On June 2, 2025, the legal battle between the U.S. Securities and Exchange Commission and Ripple momentarily faded from focus. Instead, investor attention shifted to a major institutional move: Bitgo and ViviPower confirmed a strategic partnership involving a $100 million XRP acquisition for treasury use. This announcement sparked fresh demand for the token.
Attorney John Deaton, known for his role as amicus curiae in theRipple case, commented on the development. He said companies are beginning to mirror Michael Saylor’s Bitcoin strategy—using digital assets as corporate treasury tools.
“I also said that what Michael Saylor was doing with Bitcoin… other companies would likely copycat with certain altcoins, including ETH, XRP, and SOL,”
Deaton noted.
The growing interest from corporate buyers could shift XRP’s supply-demand dynamics in its favor.
Still, the Ripple lawsuit remains central to XRP’s long-term trajectory. A final settlement, along with the resolution of both Ripple’s appeal and the SEC’s cross-appeal, could open the door to an XRP spot exchange-traded fund.
If the SEC approves any of the pending XRP spot ETF applications, XRP could see flows similar to those that followed Bitcoin spot ETF approvals earlier this year.
Deaton addressed the ETF outlook directly, stating,
“After the Bitcoin Spot ETF was finally granted… I said that I had zero doubts about Alt-Coin ETFs eventually following—not just ETH ETFs, but XRP, SOL, and others.”
Several asset managers are waiting on SEC decisions, including 21Shares, Bitwise Invest, Canary Funds, Franklin Templeton, Grayscale, and WisdomTree.
