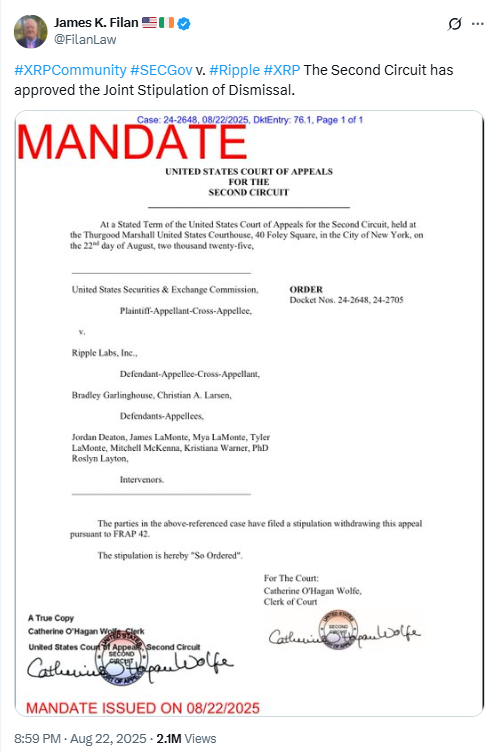
Ripple’s long battle with U.S. regulators reached a turning point after the Court of Appeals for the Second Circuit finalized the dismissal of Ripple’s appeal on August 22. The decision closed the door on further appellate proceedings in the Securities and Exchange Commission lawsuit. The ruling confirmed that XRP traded on public exchanges is not a security, though institutional sales remain subject to registration requirements. This clarity sets an important precedent for digital assets across U.S. markets.
ETF Issuers Move Quickly
Following the ruling, major asset managers including Canary, CoinShares, Franklin Templeton, 21Shares, WisdomTree, Grayscale, and Bitwise submitted updated filings for spot XRP exchange-traded funds. Their swift response underscored how legal clarity has strengthened the case for institutional investment products tied to XRP. The filings arrive as regulators face pressure to accelerate approvals for crypto-linked ETFs beyond Bitcoin and Ethereum.
In Asia, Bank Negara Malaysia placed XRP in a category of potential substitutes for cash and deposits. A working paper released under “Project Mawar” compared XRP alongside Bitcoin with monetary aggregates such as M1, M2, and M3. The analysis signaled growing central bank interest in private tokens, though the report also stressed that significant challenges remain before XRP or similar assets can be adopted widely as legal tender.

At the same time, XRP’s core utility as a cross-border settlement tool is drawing renewed attention. Analysts highlight its speed and low transaction costs as competitive advantages in international payments. With Web3 adoption accelerating, market participants are positioning XRP as a bridge currency that could link traditional banking systems with decentralized finance infrastructure.
XRP Chart Forms Bullish Pennant With 75% Upside Potential
The XRP/USDT daily chart from TradingView, created on August 25, 2025, shows the token consolidating within a bullish pennant pattern after a sharp rally. A bullish pennant pattern forms when price surges strongly, then enters a narrowing consolidation shaped like a small symmetrical triangle. This formation signals that buyers are temporarily pausing before potentially driving the next leg higher.
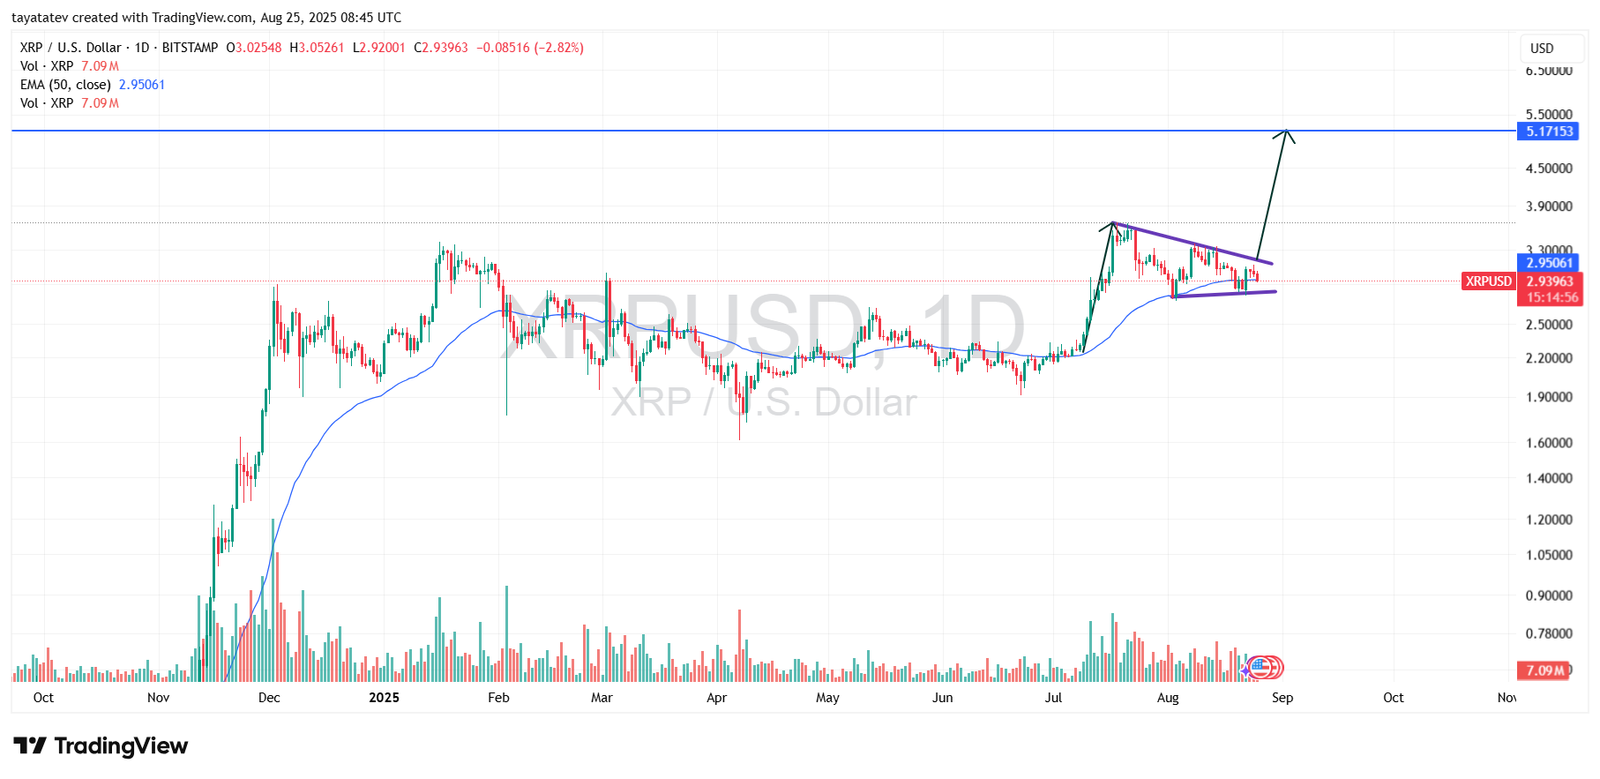
In this chart, XRP trades around $2.93, holding above the 50-day exponential moving average at $2.95. The pennant’s support and resistance lines converge, reflecting reduced volatility while market participants wait for a breakout. If the pattern confirms with a decisive move above resistance, it projects a continuation equal to the height of the earlier rally. That measure points toward a 75 percent upside, setting a potential target near $5.17.
Volume behavior further supports this setup. Trading activity has declined during consolidation, which is typical for pennants, suggesting that momentum is building for the next breakout attempt. A surge in volume accompanying a move above resistance would validate the bullish continuation signal.
The broader structure highlights that XRP has held a strong base above $2.50, avoiding deeper pullbacks despite market volatility. With legal clarity from U.S. courts and growing global recognition of XRP’s payment utility, the technical picture aligns with a market preparing for higher ranges. However, the pattern’s reliability depends on confirmation. Without a breakout, XRP could remain range-bound until market conditions trigger stronger directional flows.
XRP Relative Strength Index Points to Neutral Momentum
The daily Relative Strength Index (RSI) chart for XRP, created on August 25, 2025, shows the oscillator at 45.94, with its moving average at 49.36. The RSI measures the speed and magnitude of price changes, offering signals of overbought and oversold conditions.
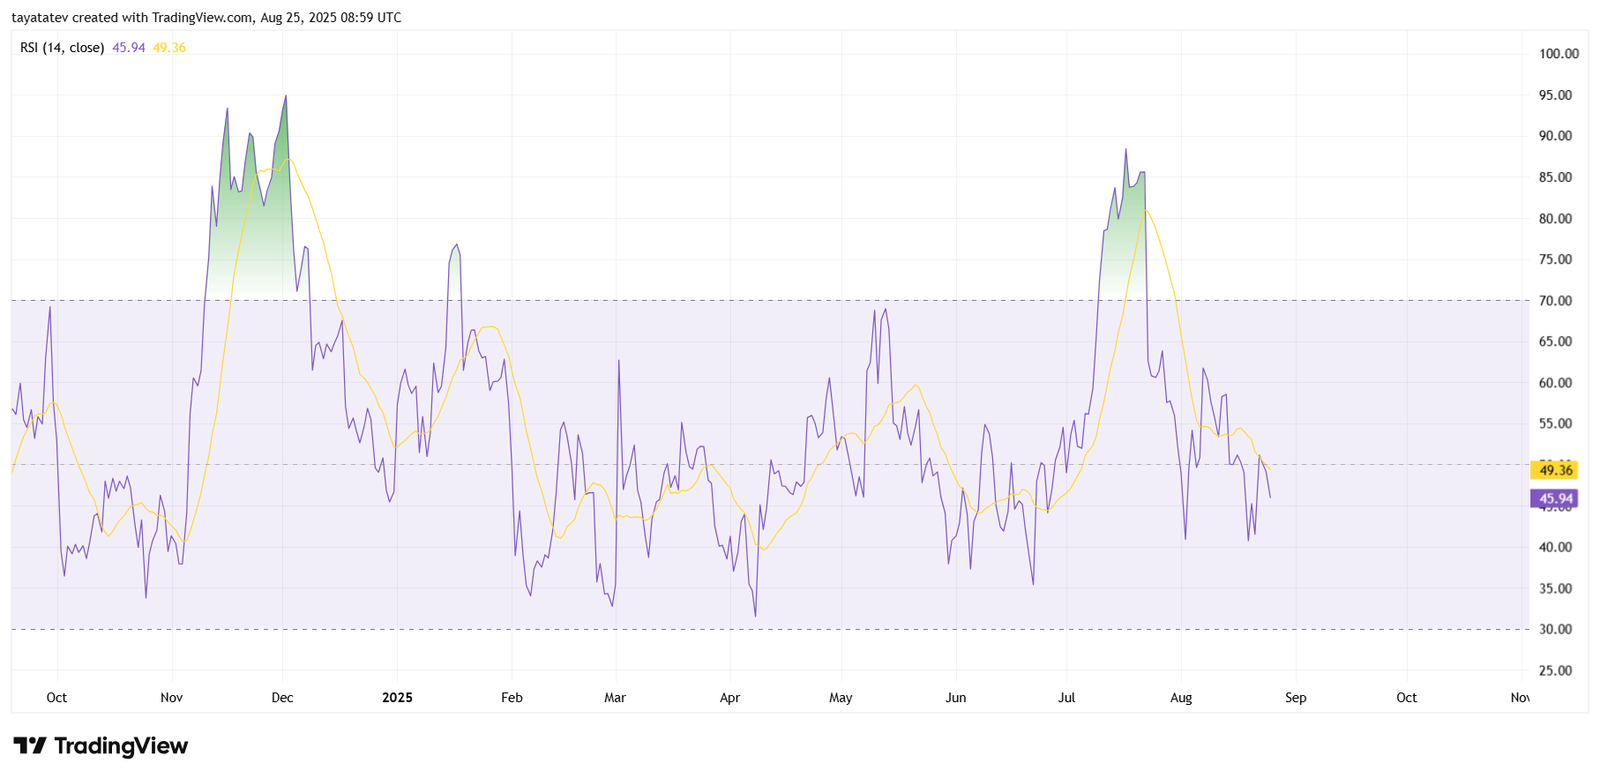
Currently, XRP trades in the neutral zone, neither above 70 nor below 30. This level indicates that bullish and bearish pressures are balanced after the recent correction. The decline from overbought conditions in July–August has shifted momentum downward, but the index remains above oversold territory, suggesting consolidation rather than a breakdown.
The RSI’s moving average is trending slightly above the current RSI value, pointing to mild bearish divergence. This implies that sellers still maintain some control, although the market is not in a strong downtrend. A rebound toward the 50–55 zone would confirm renewed buying strength, while a move below 40 could increase downside pressure.
Overall, the RSI indicates that XRP is stabilizing after its recent rally. The neutral position provides room for buyers to step in if broader market catalysts, such as legal or adoption developments, spark renewed momentum.
XRP MACD Signals Bearish Momentum but Potential Stabilization
The Moving Average Convergence Divergence (MACD) chart for XRP, created on August 25, 2025, shows weakening momentum after the strong rally earlier this summer. The MACD line is at –0.01641, while the signal line stands slightly higher at 0.00462, keeping the histogram in negative territory at –0.02103.
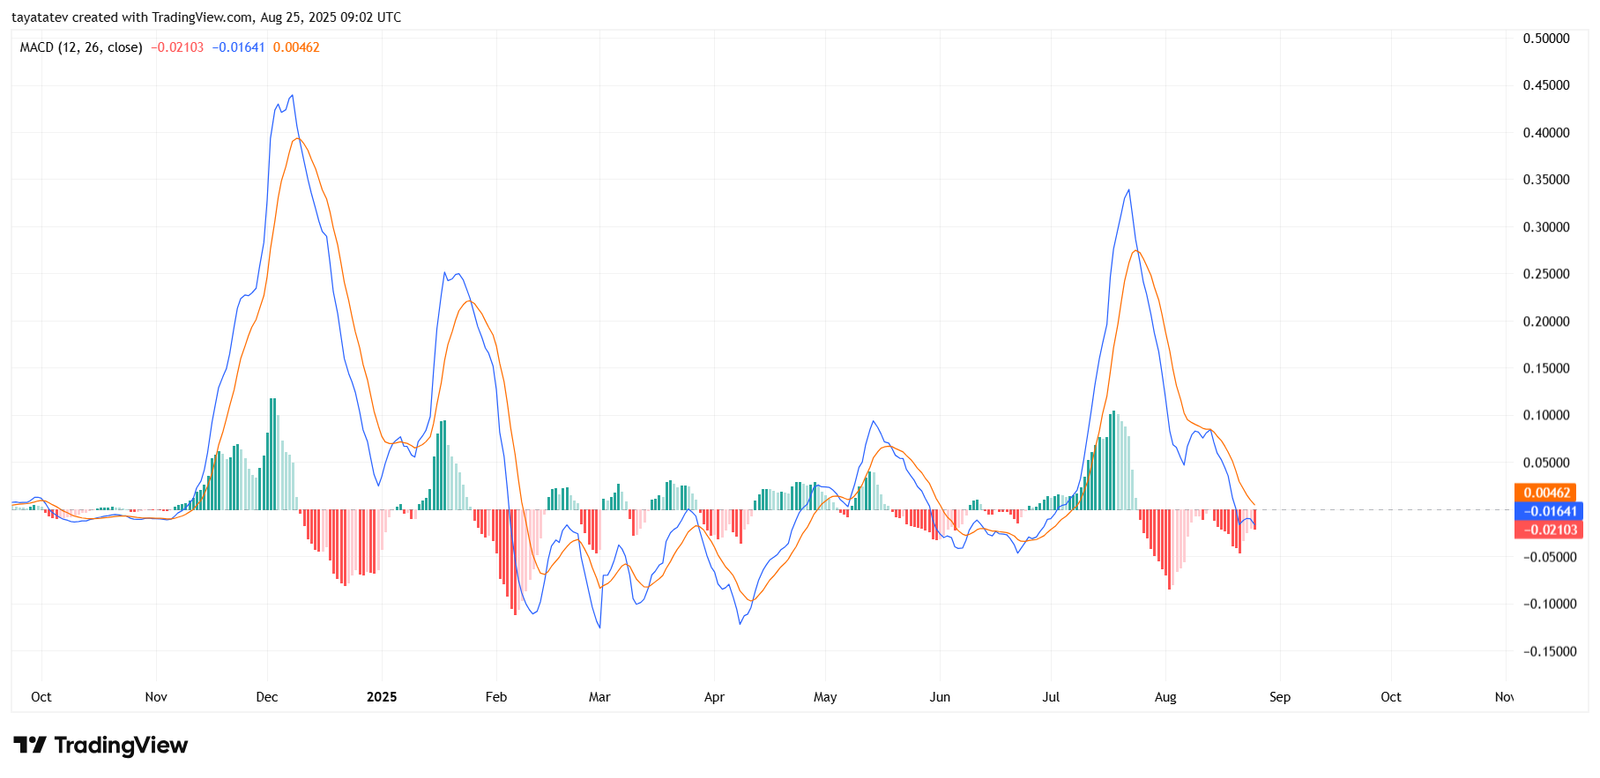
The MACD measures the relationship between short-term and long-term moving averages. When the MACD line crosses below the signal line, it indicates bearish momentum, as seen in the recent crossover in mid-August. The histogram’s sustained red bars reinforce this bearish pressure, showing that selling momentum remains in control.
However, the declining slope of the histogram bars suggests that the bearish wave is losing strength. If the MACD line begins to rise toward the signal line, it could signal a pending shift in momentum. A confirmed crossover above the signal line would open the path for renewed bullish pressure, aligning with the bullish pennant formation visible on the price chart.
Overall, the MACD highlights current weakness but points toward possible stabilization. The next move depends on whether XRP consolidates long enough for the MACD to reset and form a bullish crossover, which could support the projected continuation pattern toward higher levels.
