
XRP derivatives Open Interest (OI) on Binance surged to a new record earlier this week, hitting $3.9 billion before retreating to $3.08 billion, according to CryptoQuant. This rise in OI signals a sharp increase in speculative capital entering the XRP market.
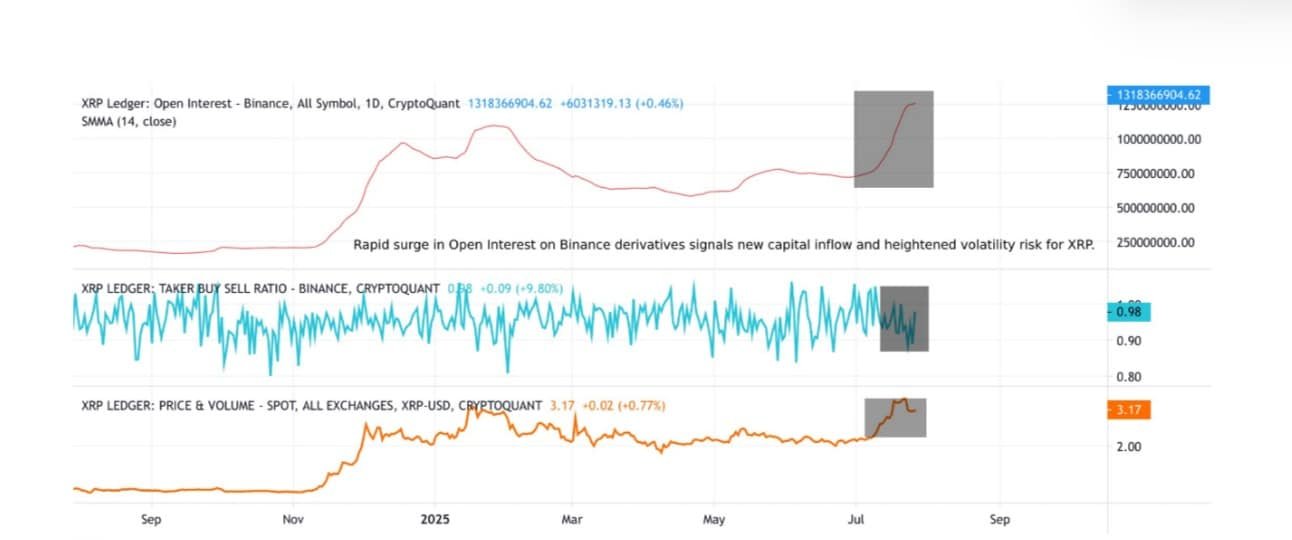
Typically, rising OI during sideways price movement hints at an impending breakout, often triggered by liquidation events. This pattern suggests that market participants are positioning themselves for significant volatility ahead.
Short Positions Take the Lead
Derivatives market data from CoinGlass shows a clear tilt toward bearish sentiment. On July 27, the Long/Short Ratio stood at 0.96. Short positions made up 50.77% of all XRP futures contracts, while longs accounted for 49.23%. This imbalance indicates that more traders expect XRP to drop in the short term.
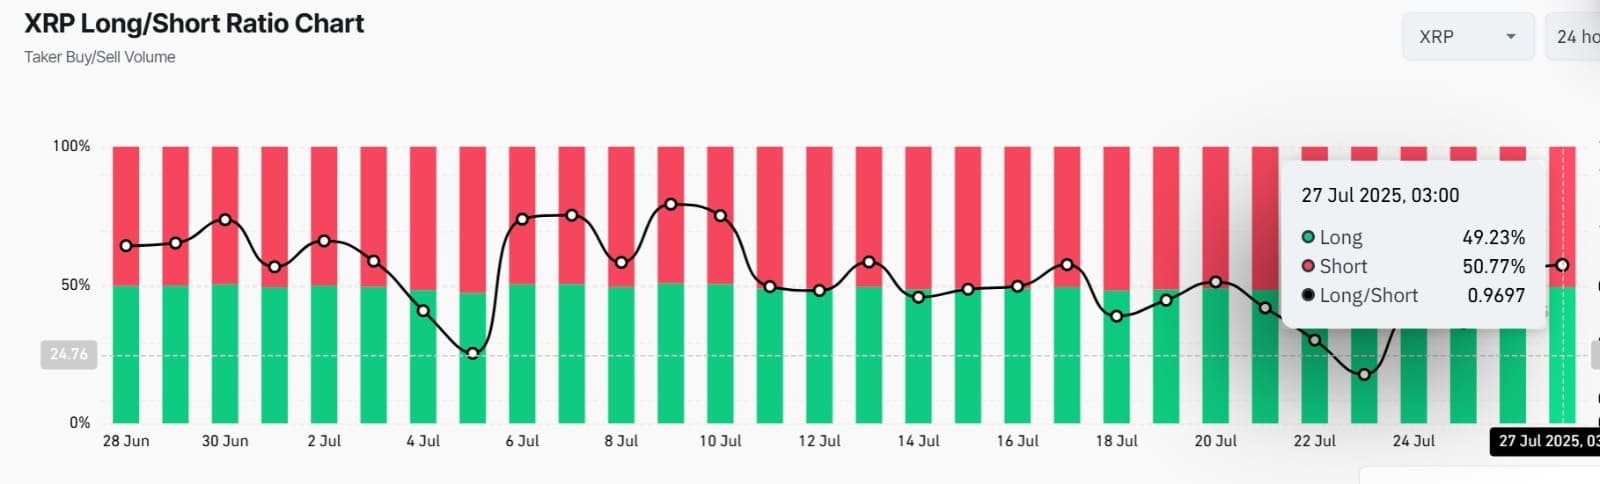
A higher short concentration can also set the stage for a short squeeze if the market unexpectedly moves higher, forcing bears to close positions.
XRP Exchange Netflows have remained positive for two consecutive days, pointing to sustained token inflows into centralized platforms. CoinGlass data shows Netflow reached $1.28 million at press time, up slightly from $1.21 million the previous day.
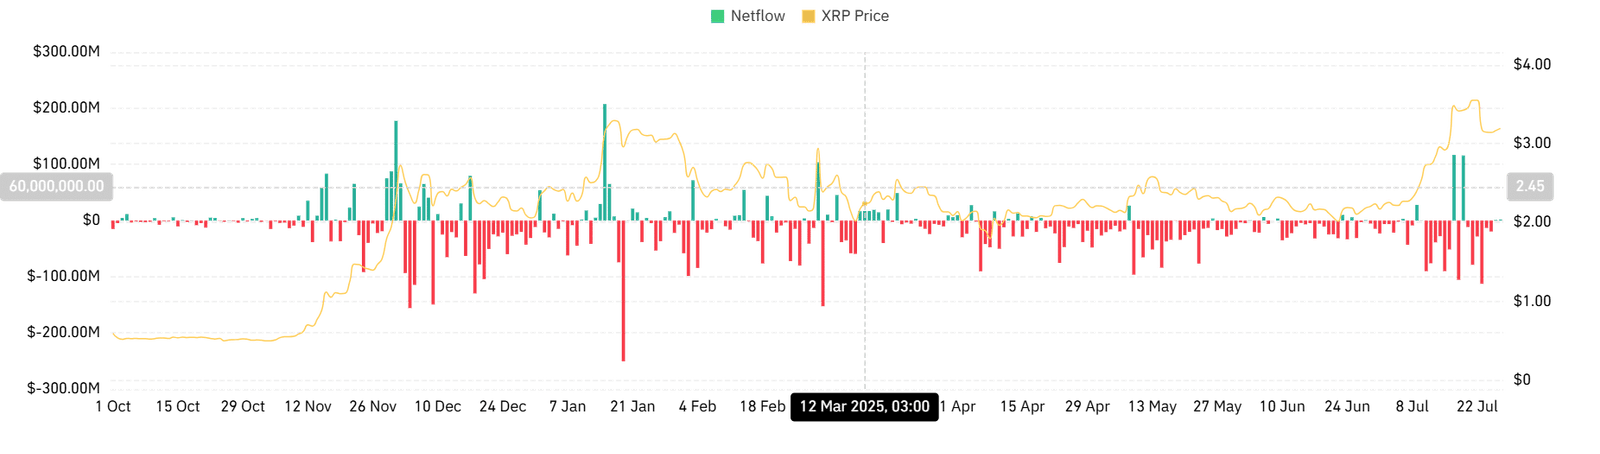
Positive netflows often suggest that traders are sending XRP to exchanges to sell, a pattern that adds to downward pressure unless matched by strong buyer demand.
For now, XRP remains in a tight consolidation zone, with rising OI, short dominance, and increasing exchange inflows all painting a picture of cautious but elevated market activity.
Rising Wedge Pattern Forms on XRP Chart, Hints at 12% Downside Risk
On July 28, 2025, an XRP chart created on TradingView showed a clear rising wedge pattern. This pattern formed between July 24 and July 28, visible on the 1-hour timeframe. A rising wedge is a bearish formation where the price makes higher highs and higher lows, but the slope of the support line is steeper than the resistance line. It often appears during an uptrend and suggests that the upward momentum is weakening.
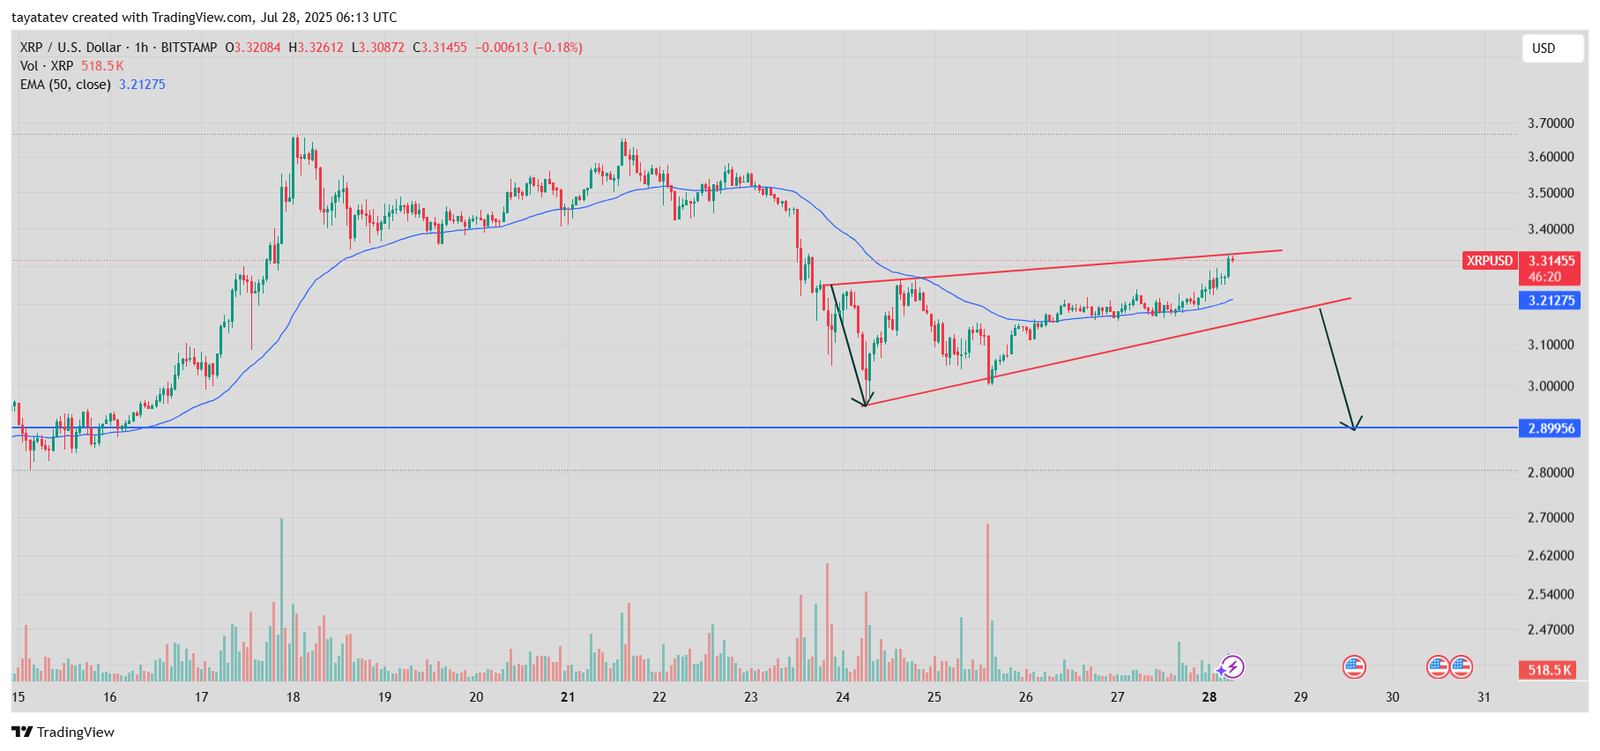
In this case, the XRP price moved inside converging trendlines and reached around $3.31. The EMA 50 line, which currently sits near $3.21, supports the wedge’s structure. If this pattern breaks down, it often signals a price drop. Based on the wedge’s height, the projected move suggests a potential 12% decline from the current level. This would push XRP’s price to approximately $2.90, a target that aligns with the horizontal support drawn on the chart.
The arrows placed on the chart also indicate this expected drop, suggesting a bearish reversal may follow if the price fails to break the upper trendline. For now, the structure warns of selling pressure building up under the surface.
XRP MACD Crossover Suggests Short-Term Momentum Shift
On July 28, 2025, the XRP 1-hour chart shows a Moving Average Convergence Divergence (MACD) crossover, signaling a shift in short-term momentum. This crossover happened when the MACD line (blue) moved above the signal line (orange) and is now at 0.02861 versus 0.01979. The histogram turned green, reflecting growing bullish pressure.
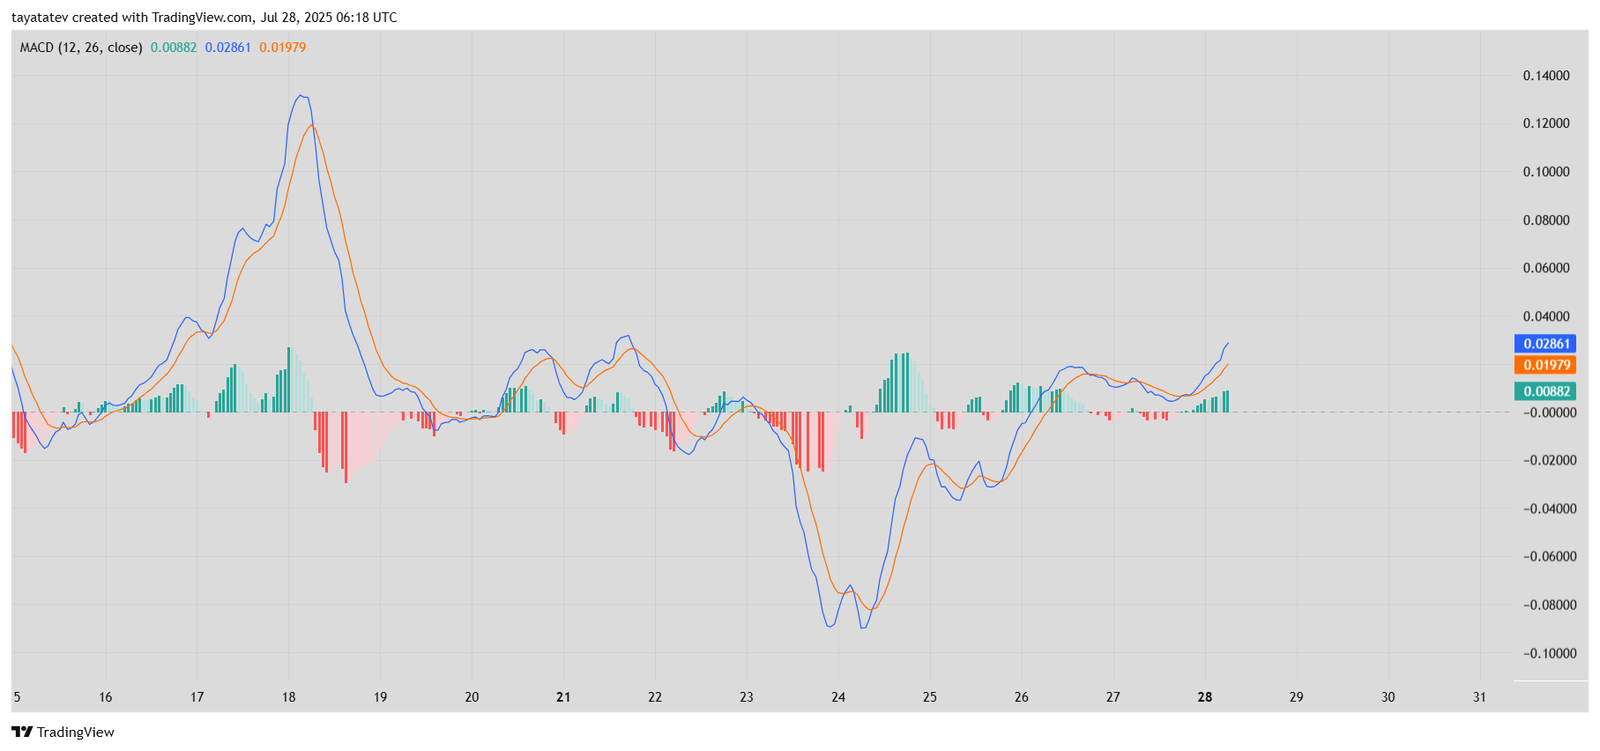
MACD is a momentum indicator that tracks the difference between two moving averages. A crossover like this often suggests early signs of upward movement, especially when confirmed by increasing histogram bars.
While the rising wedge pattern in the earlier chart hinted at a possible 12% drop, this MACD crossover adds a conflicting short-term signal. It means XRP might try another bounce before deciding on a clear direction. If buying continues, the wedge pattern could fail—but if momentum fades, the bearish setup could still play out.
For now, this MACD formation shows XRP gaining strength temporarily, though traders should watch closely for confirmation or rejection around the $3.31 level.
XRP RSI Nears Overbought Zone on July 28, Signals Caution
The XRP 1-hour chart, published on July 28, 2025, shows the Relative Strength Index (RSI) nearing the 70 level, which typically marks the start of the overbought zone. As of the latest candle, the RSI reads 69.47, just under the overbought threshold, while the signal line tracks at 62.92.
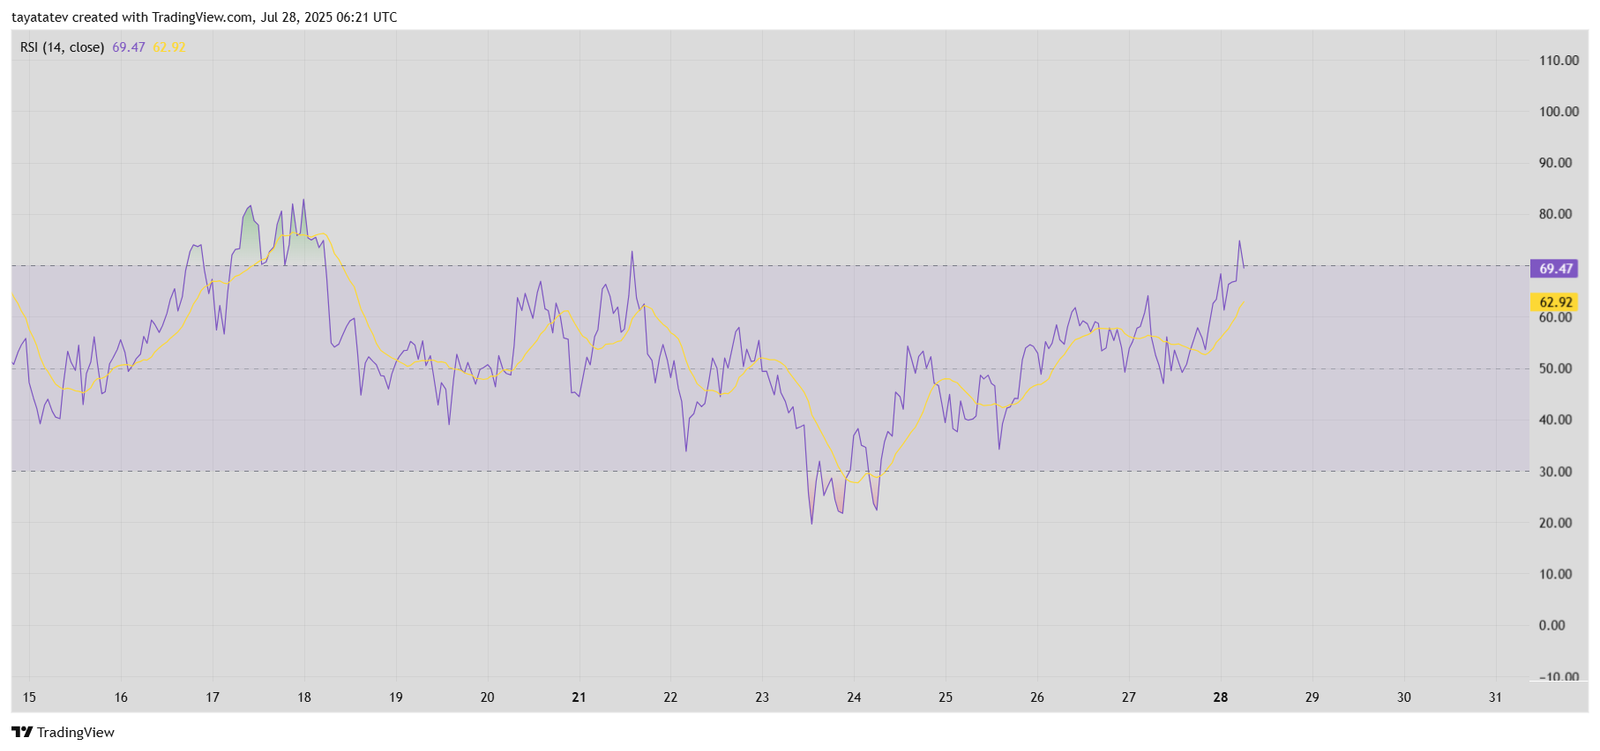
The RSI is a momentum oscillator that measures how fast and strongly price moves. When it crosses above 70, it suggests the asset may be overbought, hinting at potential short-term exhaustion in the uptrend. This means buyers may start taking profit soon, leading to a pullback.
In XRP’s case, the RSI climbed steadily since July 24, tracking the price increase within a rising wedge pattern. Now, with RSI approaching the overbought region, traders may become cautious, especially if combined with bearish technical structures like the wedge. A reversal is not guaranteed, but momentum could slow down soon if the indicator starts turning down from current levels.
This RSI setup supports the short-term caution signaled by previous chart patterns, even as momentum indicators like MACD still show near-term strength.
XRP SMI Climbs Above 60 on July 28, Suggests Uptrend Still in Motion
On July 28, 2025, the 1-hour Stochastic Momentum Index (SMI) chart for XRP shows both the main line and the signal line rising above 60. The blue line, which is the SMI value, reached 64.30, while the orange signal line sits at 61.00. The lines crossed upward on July 27 and continue climbing, indicating growing momentum.
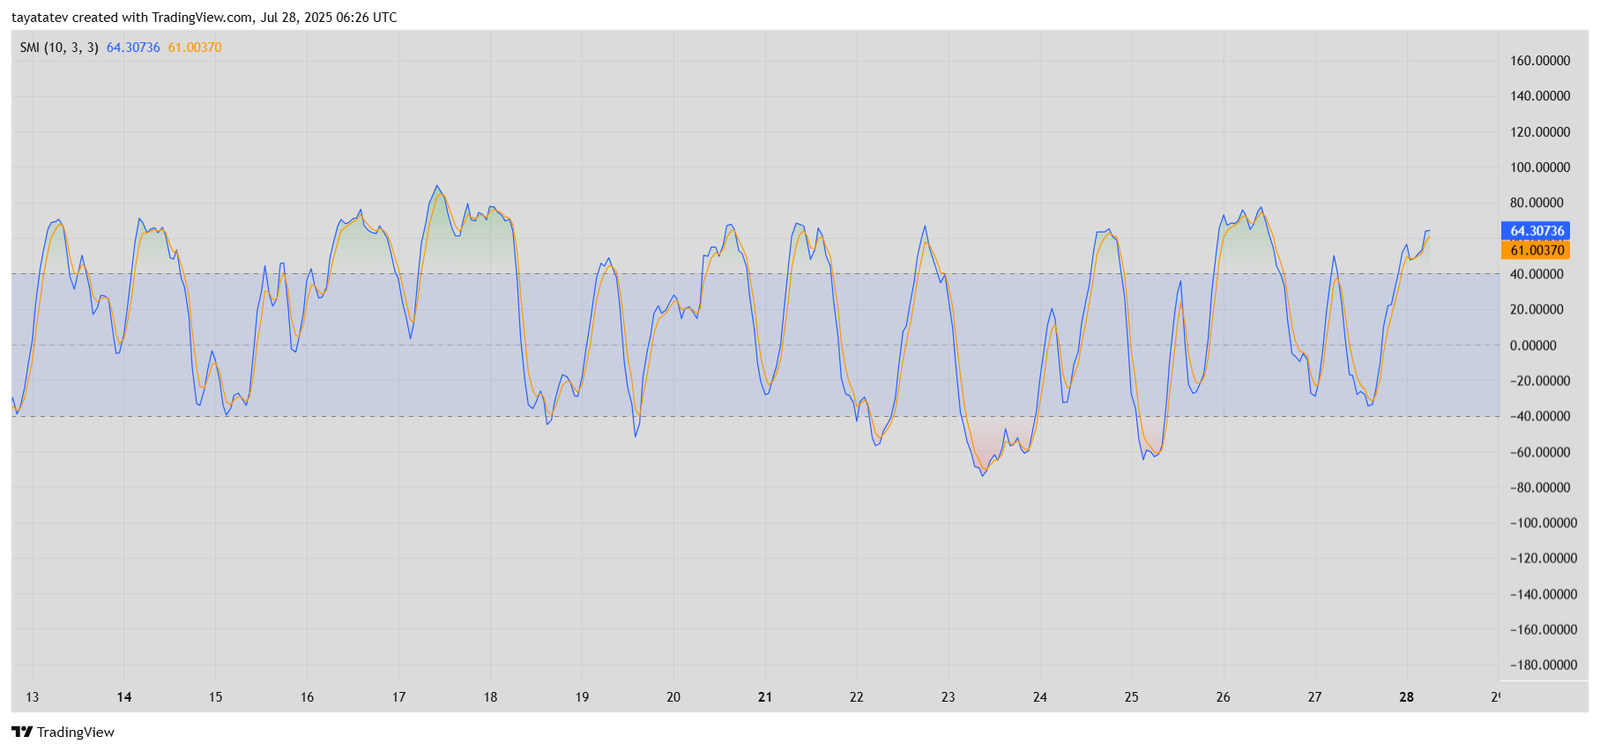
The SMI measures the closing price relative to the midpoint of recent highs and lows. It works like the Stochastic Oscillator but is more sensitive to shifts in direction. When both lines rise above 40 and move together, it typically signals that bullish momentum is active.
This latest chart suggests that XRP’s short-term strength remains intact. It supports the recent MACD and RSI readings, which also showed positive pressure. However, the SMI is approaching the overbought region near 80. If it turns down from there, it could mark a reversal or pause in trend.
As of now, the SMI indicates that momentum favors bulls, but the market is getting close to short-term exhaustion levels. Traders should monitor closely in case signals start to flatten or diverge.
